


 |
|
5. The Promise of NIMA
Most who have tried
to reconstruct the logic that put NPIC and DMA together into the National
Imagery and Mapping Agency have concluded that it was the potential, profitable
convergence of imagery and geospatial processes and products. And, while
it is but a few years since the inception of NIMA, it is disturbing, nonetheless,
that convergence has not occurred more rapidly and more completely. There
remains the cultural divide between the Imagery Analysts (IAs) and the
geospatial analysts (geographers and cartographers, by another name.)
Is it merely human nature to resist such change, or perhaps that the presumed
competition between the two groups or functions would inevitably produce
winners and losers? Or, is there something more fundamental, some logic
that would keep separate the two functions? Have we just failed thus far
to find the unifying theme(s)?
Belief in the convergence
of imagery and mapping is not limited to this side of the Atlantic. Less
than a year ago it was announced in British Parliament that the Defense
Geographic and Imagery Intelligence Agency (DGIA) would be formed by merging
JARIC and Military Survey--respectively, the NPIC and DMA of the UK. Each,
of course, has its own history and culture: JARIC dates from the Second
World War, while Military Survey recently celebrated its 250th anniversary.
The logic of the merger was that
[benefits] will
come as digital technology allows the work of the agencies to be increasingly
integrated in future, including the production, storage and handling of
similar sorts of data....It is not just increasingly common sources of
data and developing digital processes that are pulling the two agencies
together. There is also an increasing requirement for the agencies' outputs
to contribute to a common intelligence picture required by their defense
'customers' ...8
5.1
Convergence of Imagery and Geospatial Processes
Imagery and geospatial
activities, now housed in one organization, NIMA, vice two--NPIC and DMA--continue
to elude one another to a large extent. Putatively, the vision behind
the amalgamation of the two organizations was the emerging construct of
geospatial (digital) data that could intellectually encompass imagery
and imagery analysis. This is vexing to some, while reinforcing the biases
of others. Still, it is time to question the fundamentals of the assimilation
argument.
 A
digital dataset of geospatial consequence has certain characteristics.
Each "record" contains coordinates that relate it to a point, line, surface
or volume about the geosphere. For most items, there is strong data typing,
wherein the respective data types (or features) relate to interesting
human activities and permit interesting operators to work on the items. A
digital dataset of geospatial consequence has certain characteristics.
Each "record" contains coordinates that relate it to a point, line, surface
or volume about the geosphere. For most items, there is strong data typing,
wherein the respective data types (or features) relate to interesting
human activities and permit interesting operators to work on the items.
The dataset may include
rivers and marshes, mountains and valleys, political jurisdictions, and
the road to grandmother's house. The dataset can be displayed as a "map"
with which we can facilitate any number of human activities. Each "record"
in the dataset should also be "time-tagged" as well as geospatially referenced.
So, is an image such
a dataset? Or, is it such a datum? A picture of grandmother can be geospatially
referenced so that it can be viewed by clicking on grandmother's house's
location on the map. How about a reconnaissance image, perhaps one from
which the map was "made"--i.e., one from which the digital dataset was
extracted. It, too, can be geospatially referenced and accessed via the
"map," but is it more than that?
From a GIS perspective,
this discussion is reminiscent of arguments about the natural superiority
of raster-over digital datasets, or the reverse. To the simplistic map
user, the map is "the thing" and the digital dataset is a necessary evil,
about which the less heard the better. To the GIS advocate, the digital
dataset is "truth" and the map is just a view of the dataset, rendered,
usually, by "rastering." However, the image from which the digital dataset
features may have been extracted (i.e., from which the map was made) cannot
be "created" (or even "recreated") by a rendering (rasterized or otherwise)
of the digital GIS dataset.9
In a totally uninteresting
sense, of course, the image--as it was erected on the focal plane of the
reconnaissance satellite--was pixilated and digitized by the CCD array
and captured as a two-dimensional array of numbers, which incidentally
are of most interest to a rastering display device. Sufficient meta-data
are captured and associated with the image to describe the "camera model,"
the time of acquisition, the ephemeris data of the collection vehicle,
and the pointing angle--that, together with information about the earth's
rotation--can translate into geocoordinates of the image (and its pixels.)
As a database element, an image is rather unremarkable.
However, an image
is something that eons of tinkering with the human hardware and software
have allowed us to collect and interpret (task, process and exploit) "with
the naked eye." Consequently, an image has a primary place in our consciousness.
We can relate to an image in precortical ways that we cannot relate to
a map. On the other hand, over those same eons, we have acquired the capability
to extract features from an image and render it so as to be able to communicate
(disseminate) it to others. We have also acquired the capacity to compile
geospatial datasets not only from images but from our own wanderings and
from words about the wanderings of others--simply, we have learned to
sketch maps.
Finding, with the
help of today's technology, easier and more useful ways of moving between
images, GIS datasets, renderings, and words is the key to removing today's
constraints on today's TPED. Seeking convergence between cartography and
imagery analysis--and merging more closely together their respective work--is
particularly promising.
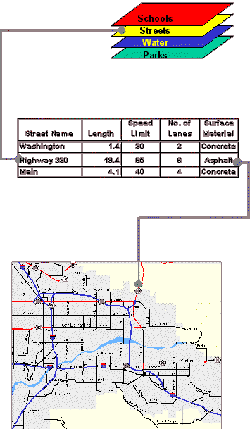
The products are converging,
most demonstrably in "image maps" where vector data sets--road and telecommunications
networks, say--are overlaid on orthorectified imagery. The advantage of
such products, inter alia, is that a dated vector data set can
be overlaid on an up-to-date image, allowing the end-user to "update"
his perceptions. Another, compelling example of the power of fusing vector
data with imagery is to "drape" the image (or pieces of several) over
a terrain model to create the now classic "fly-throughs."
The systems, too,
are converging. IEC, the replacement terminal for the IDEX soft-copy imagery
analysis system, will have the vector capabilities better known to the
modern cartographer as well as the imagery analysis functionality more
familiar to the IAs.
There is reason to
believe that imagery analysts can move to a higher plane if they have
some of the arrows in the cartographer's quiver. And, of course, for NIMA,
the more in tune with intelligence analysis the cartographer becomes,
the more valuable to the enterprise he or she becomes.
5.2
What Did the Geographer Know...and When Did He Know It?
The "electronic geographer"--i.e.,
today's cartographer, creator of GIS datasets--exploits a satellite reconnaissance
image by finding, measuring, and recording natural and cultural features
of interest. This extraction of "feature sets" is highly stylized and
is made measurably easier if the image is a soft-copy image and if the
computer has a relatively simple toolkit that references points and clicks
to the image's coordinate system--i.e., georeferences the selected features--and
provides a set of menu picks that embody the vocabulary of cartography--e.g.,
unimproved roads, bridges, etc.
The cartographer is
all about making accessible a set of geographic information, which can
be used subsequently--generally by others as yet unspecified--to accomplish
a task. The cartographer is about making a "map", by which an aviator
might navigate, or a real estate developer might site a shopping center,
or an armchair traveler might experience exotic places.
5.3
What Did the Imagery Analyst Know...and When Did She Know It?
By contrast with the
geographer, the image analyst is about "storytelling"-like the legendary
native scouts who could read subtle signs in the dust to recount the passage
of game or interpret the activities of those who had camped there previously.
In fact, however, the image analyst also "extracts features" such as the
size and shape of new military construction, the extent and character
of security fencing, and the direction of tank tracks through a trackless
waste. Frequently, the extraction of these features is made easier for
the imagery analyst by software tools that look suspiciously like those
of the cartographer--and yielding deliciously similar digital data sets.
Alas, our image analyst
does not generally regard the digital data set so derived as a product;
it is frequently reduced to a textual description in an intelligence report.
In this translation to intelligence prose, considerable information--all
the bits and bytes that might support rendering a "real" picture vice
a word picture--is lost to posterity. Worse than posterity, it is unavailable
when that subject military facility is next imaged and must again be exploited,
perhaps by the selfsame imagery analyst, who rereads her previous report
and recreates in her mind's eye the picture.
In fact, we could
capture much of the exploitation as digital datasets that would support:
- Illustrations for
the intelligence report,
- Templates for smartly
extracting an image "chip" for dissemination,
- Feature overlays
on "imagery maps," and (thus)
- An aid to the subsequent
exploitation of the next image of that target.
The technically inclined
reader will note that such a derived digital dataset supports the ultimate
in smart bandwidth compression. It permits faster dynamic overlays of
historical images, and can more easily travel the "last tactical mile."
Automatically compatible with ELINT-derived datasets, it advances us toward
the holy grail of "multi-INT" TPED.
5.4
Convergent Systems and Convergent Products
To reiterate, a principal
reason for the creation of NIMA was the recognition of the benefits of
imagery and geospatial integration. The Commission has heard anecdotes
of such integration (e.g., specialized, tailored products for areas
in the Balkans were developed), but was unable to find evidence of a strategic
plan to make such cooperation routine. A recent study sponsored by the
ADCI/Collection indicated that GIS tools that link diverse information
to physical locations via layers could improve analysts' understanding
of their intelligence problems. Such tools can also improve multi-INT
analysis, if the data are presented in the proper format. In addition,
use of such tools and the collaboration of analysts and collection managers
can improve collection planning and efficiency.
The imagery and geospatial
community is in the process of replacing its primary image-exploitation
workstation, IDEX.10
The goal was to finally move away from the light-table exploitation of
film and toward soft-copy exploitation by computer. The technical challenge
has always been the "need for speed." While just how big our satellite
images are is classified, suffice it to say that they are Big! And they
have gotten bigger just as computers have gotten faster. Simply rendering,
panning, zooming, and rotating such images has remained just slightly
beyond the reach of affordable desktop computers for two decades.11
Ultimately successful, IDEX was a troubled development of custom hardware
and software with display power still beyond commodity desktops. It has
come to incorporate a number of powerful raster-image manipulation algorithms.
It does not, however, support the more commonplace vector manipulations
favored by Geospatial Information Systems (GIS). So, unfortunately, it
does not promote the desired convergence of disciplines.
The latest-generation
IDEX "replacement" is IEC. It does support the GIS operations. Good! It
does not, however, quite match the custom-designed raster-image capabilities
of IDEX. Bad! Unless it is modified so it does, the fingers of the hardcore
imagery analysts will have to be pried from their IDEX stations. Without
widespread and enthusiastic acceptance of IEC or equivalent, the promised
convergence of imagery intelligence with mapping, charting, and geodesy
will remain an unrealized dream.
5.5
A Tale of Two Cities
[The story you are
about to read is true. All the details have been changed by "security."]
Washington, DC--Imagery
Analysts (IAs) face the daunting task of searching a large, denied area
in order to locate particular pieces of deployable military hardware.
The alternative of taking high-resolution satellite imagery of the entire
country and searching it, square meter by square meter, is prohibitive.
Sufficient imaging capacity to do the job cannot be freed up, nor would
it be feasible to image the entire country in a sufficiently short space
of time to be confident that the hardware had not redeployed, hop scotch
fashion, from as-yet-unimaged locations to previously imaged locations,
in the interim. In any event, sufficient IA-hours are not available to
conduct so brute-force a search.
St Louis, MO--Geospatial
Analysts review the geography, topography, and cultural features-- road,
rail, and power networks; hills and dales, forests and clearings--correlated
with previous sitings (sightings) of such equipment. A factor analysis
later, the Geospatial Analysts prepare a "map" (vector dataset) that provides
the template for where to search--where to image and where to exploit.
Washington, DC--The
IAs get the picture!
But, do they really
get the picture? Is this a story about IAs who "subcontract" for collateral
information? Or, is this a story about the ascendance of the Geospatial
Analysts who, faced with a vexing intelligence problem--"map" the locations
of subject hardware--and proceed to produce said map, showing probable
future- and confirmed present-sites, with workaday assistance of trained
eyeballs (to be replaced, when cost-effective, by computerized pattern
recognition)? Or, is this a triumph of "collaboration?" Or, does it presage
the next generation of intelligence professionals, schooled in both
imagery and geospatial analysis disciplines?
More generally, NIMA
is examining the feasibility of collocating regional specialists to encourage
better integration of imagery and geospatial information. The Commissioners
were made aware of a planned "experiment" to integrate Latin America imagery
and geospatial analysts, i.e., collocate those analysts who are Latin
American specialists. The Commission lauds this "experiment" but urges
NIMA to include the experiment as part of the larger development of a
geographic information database. Furthermore, NIMA should set explicit
goals and performance metrics to determine whether collocation and integration
works, how well it works, and how it may be extrapolated to other parts
of NIMA.
5.6
"Magic Maps"--Another Kind Of Convergence
 Imagine
being able to unfold a paper map and look at it "through the lens" of
a computer network appliance. Suddenly the paper map would spring to life,
show terrain in 3-D, show moving mobile SAMs actually moving, and see
their effective threat envelope as upside down sugar loaves. And, as you
moved the paper map from side to side, or rotated it, the "erected" data
images would move in synchrony, allowing you to view the terrain from
any perspective. Just such technology is emerging from the laboratory.
Augmented or mixed reality (AR) research aims to develop technologies
that allow one to mix or overlap computer generated 2-D or 3-D virtual
objects on the real world. Unlike virtual reality that replaces the physical
world, AR enhances the physical reality by integrating virtual objects
into the physical world, which become in a sense an equal part of our
natural environment.12 Imagine
being able to unfold a paper map and look at it "through the lens" of
a computer network appliance. Suddenly the paper map would spring to life,
show terrain in 3-D, show moving mobile SAMs actually moving, and see
their effective threat envelope as upside down sugar loaves. And, as you
moved the paper map from side to side, or rotated it, the "erected" data
images would move in synchrony, allowing you to view the terrain from
any perspective. Just such technology is emerging from the laboratory.
Augmented or mixed reality (AR) research aims to develop technologies
that allow one to mix or overlap computer generated 2-D or 3-D virtual
objects on the real world. Unlike virtual reality that replaces the physical
world, AR enhances the physical reality by integrating virtual objects
into the physical world, which become in a sense an equal part of our
natural environment.12
This fusion of computer-generated
visualizations of vector data sets and paper maps is particularly intriguing
as it may allow us, literally, to overlay new technology on legacy products.
And, of course, it can be "multi-INT," fusing additional data derived
from HUMINT and SIGINT. From the user's point of view, an especially appealing
characteristic of such a "magic map" is its graceful degradation in the
face of computer malfunction. We have augmented the map with computer-generated
displays, but, if all else fails, the old standby map is as effective
as it ever was. Moreover, the ability to overlay vector data onto maps
in this way allows the soldier to simply mark up his map with traditional
symbology without having to shift his gaze or attention away from the
paper. Imagine sending an update to be marked on a map without having
to use coordinates--sending, as it were, directly to the eye of the soldier
who needs to annotate his map, or to the navigator or mariner who needs
to update his chart.
Footnotes:
8
(UK) Select Committee on Defense Fifth Report--THE DEFENCE GEOGRAPHIC
AND IMAGERY INTELLIGENCE AGENCY.
9
In a technical sense, we have lost some information when we "transformed"
the image into the vector data set (but, hopefully no interesting information).
Of course, working with the vector dataset we also add other information.
10
The roots of IDEX go back at least a quarter-century to a research effort,
IDEMS, conducted by CIA's since-disbanded Office of Research and Development
(ORD) on behalf of CIA's since-absorbed National Photographic Interpretation
Center (NPIC). IDEX can also trace its roots to the Air Force COMPASS
COPE effort at Rome Air Development Center (RADC).
11
A lot of tricks have been tried. In the BR-90, Bunker Ramo (several times
removed from TRW) married film projection with CRT technology and vector
graphics. Rotating the whole CRT was also in favor briefly.
12
"The Pop-Up Book Picks Up Magical Dimensions," New York Times,
12 October 2000, p. E7. See also http://www.hitl.washington.edu/magicbook/.
Foreword
| Executive Summary and Key Judgments
| Introduction | NIMA
from the Beginning
NIMA in Context | Two-and-a-Half
Roles for NIMA | The Promise of NIMA
NIMA and Its Stakeholders |
NIMA and Its "Customers" | Is There a "National
vs Tactical" Problem?
NIMA and Its Peers and Partners | NIMA
and Its Suppliers | NIMA Management Challenges
NIMA's Information Systems | NIMA
Research and Development
NIMA and Its Information Architecture | Recommendations
| Appendix A
Appendix B | Glossary
of Terms
Table
of Contents | Home | PDF
|