


APPENDIX E AIRCRAFT ACCIDENT ANALYSIS
E.1 INTRODUCTION
This appendix presents an analysis of the likelihood of an aircraft crash into structures located within Zones 4 and 12 at Pantex Plant and storage facilities located at the alternative sites covered in this EIS. Sandia National Laboratories performed an assessment of the probability of aircraft impact into Pantex Plant structures in the mid-1970s (SNL 1976). That study used the K. Solomon Model and included a characterization of air traffic in the area, including the classes of aircraft (e.g., commercial, military), the nature of the operations, the number of operations per year, and other information that could affect the probability of an aircraft crash at Pantex Plant Site (ANPP 1975).
DOE has recently issued a Draft Standard for Accident Analysis for Aircraft Crash Into Hazardous Facilities that presents a standardized approach and the steps used to apply the approach (DOE 1996g). The DOE Standard methodology was applied in this EIS to estimate the probability of an aircraft crash into the structures of interest. An initial screening of the release frequency, as described in the Draft DOE Standard and based on past experience, indicated that the impact frequency would require detailed analysis. Current data describing air traffic are used in the analyses for both Pantex Plant and the alternative sites. Because the Draft DOE Standard uses English units for crash rates and probability density functions, all figures and tables in this appendix are in English units to avoid confusion when comparing the results with the Draft DOE Standard.
E.2 METHODOLOGY
The determination of the probability for causing sufficient damage to a facility consists of a series of calculations as shown in Figure E.2-1. The first step in the process is to determine the representative type of aircraft for each category. Representative wingspans, engine weights, and engine diameters are calculated by either using a known set of data, i.e., the number of each type of aircraft for operations near a site (e.g., Radar Airspace Monitoring System [RAMS] data identifying the number of 737s, DC10s, MD80s, etc. for commercial air carrier landing and take-off operations near Pantex Plant), or the maximum parameters for the category if the number of each type of aircraft is unknown.
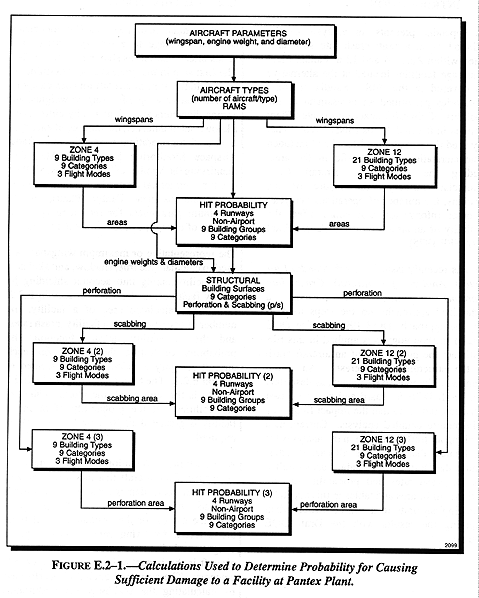
The representative or maximum wingspans are used to calculate the true, shadow, and skid area of a facility taking into account shielding by nearby facilities, as described in section E.2.2. Using the calculated area of a facility, the number of operations near a facility, crash rates, and the probability density function, the probability of hitting the facility for each aircraft category is calculated as described in section E.2.1. The total probability for hitting a facility is the sum of all the aircraft category probabilities. If the probability of hitting a facility is greater than 10-7, further analysis is required.
A structural calculation is performed to determine if an aircraft that hits a facility will cause sufficient damage to warrant further analysis. Aircraft missiles (i.e., flying objects from the crash) for the structural calculations are selected by using representative engine weights and diameters. The velocity of the aircraft is the impact velocity for each aircraft category. The structural analysis is performed by calculating the scabbing and perforation thickness for each aircraft category into the facility using an empirical model.
If an earth overburden exists, the velocity reduction through the earth overburden is calculated prior to the aircraft penetrating the facility. The roofs, walls, and doors of each facility were modeled independently when overburden or structure thickness varied. If scabbing or perforation is not possible, even though the facility can be hit, the material inside cannot be damaged and no further analysis is needed. If scabbing or perforation is possible, additional analysis is needed.
The area calculation is then performed again, eliminating the structural members whose aircraft categories cannot cause scabbing or perforation in a facility. After the area of a facility vulnerable to scabbing or perforation is determined, the probability of hitting a facility and causing either scabbing or perforation is calculated with the reduced area by using the same equation as described in section E.2.1. (This represents a conservative upper bound for causing an explosion in a facility since either a scabbed piece of concrete or a missile that has perforated a facility can cause an explosion.)
The area calculation is redone a third time, eliminating the structural members whose aircraft categories can only cause perforation, but not scabbing in a facility. After the area of a facility vulnerable only to perforation is determined, the probability of hitting a facility and causing perforation is calculated for the reduced area by using the same equation as described in section E.2.1. This represents a conservative upper bound for causing a fire in a facility since only a perforation can allow for sufficient amount of combustible materials to enter a facility. If the probability of hitting a facility and causing either scabbing or perforation is greater than 10-7, a consequence analysis is performed.
E.2.1 Calculation of Aircraft Crash Probability
The Near Airport Model is used to estimate the probability of an aircraft crash for aircraft in the take-off and landing modes; in-flight aircraft crash probabilities are determined using the Non-Airport Model (DOE 1996g:41). The Near-Airport Model uses an aircraft mode and category-specific probability density distribution to estimate the possibility of an aircraft crashing into a particular location surrounding the airport. The Non-Airport Model uses DOE site-specific information to estimate the possibility of an aircraft crashing into a particular location surrounding the airport. In both models, the calculated probability includes all types of postulated impacts, whether slight or severe in consequence (i.e., to be conservative a touch is considered a hit).
A set of indices is used in the analysis to differentiate flight modes, aircraft categories, and flight sources. These indices are designated (i), (j), and (k), respectively. The index (i) differentiates the mode of operations (e.g., landing, in-flight, take-off) and can be equal to the following values:
i = 1 Landing
i = 2 In-Flight
i = 3 Take-off
The index (j) divides the aircraft types into categories. These categories included the following values (DOE 1996g:39):
j = 1 Commercial: Air Carrier
j = 2 Commercial: Air Taxi
j = 3 Military: Large (Bomber, Cargo, and Tanker aircraft)
j = 4 Military: Small (Attack, Fighter, and Trainer aircraft)
j = 5 Military: Rotary-wing (Helicopter)
j = 6 General: Fixed-wing, reciprocating, single-engine
j = 7 General: Fixed-wing, reciprocating, multi-engine
j = 8 General: Fixed-wing, turboprop
j = 9 General: Fixed-wing, turbojet
j = 10 Rotary-wing, reciprocating engine (Helicopter)
j = 11 Rotary-wing, turbine engine (Helicopter)
The index (k) describes the flight source and can take on the following characteristics:
k = 1...n Runways
k = n+1 Non-Airport operations (high-altitude overflights, and local helicopter flights)
An approximation of the total probability per year (F) that any aircraft in any flight path, category, or mode of operation will impact structures is given by the four-factor formula:
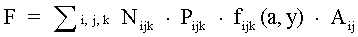
where:
F is the estimated total annual aircraft crash impact frequency for the facility of interest (number per year)
Nijk is the number of annual operations in flight mode (i), aircraft category (j), and flight source (k) (number per year, site dependent)
Aij is the effective Plant area for an aircraft of mode (i) and flight category (j) (site and aircraft dependent)
fijk(x,y) is the generic aircraft crash location probability function evaluated at the facility location for each applicable summation parameter (per square mile for Near-Airport and Non-Airport operations)
Pijk is the generic aircraft crash probability (per take-off or landing for Near-Airport and Non-Airport operations) for each applicable aircraft category, flight mode, and flight source.
Table E.2.1-1 presents a listing of the values for aircraft crash rates, Pijk.
The four-factor formula is implemented in two different ways depending of the flight phase:
- For Near-Airport operations, take-offs (i = 1) and landings (i = 3), the four-factor equation is implemented through the use of site-specific information and data contained in the Draft DOE Standard (DOE 1996g).
- For Non-Airport operations, (i = 2), DOE site-specific values for the expected number of crashes per square mile per year in the vicinity of selected DOE sites have been established. The value of the product NPf(x,y) is provided in the Draft DOE Standard for each aircraft category. The four-factor formula is implemented by multiplying this value by the facility effective area to assess hit probability.
The analysis of the impact frequency of Non-Airport operations for all categories of aircraft uses the same four-factor equation as for Near-Airport operations. The frequency, Fj, for the jth class of aircraft is
Fj = Nj × Pj × fj(x,y) × Aj
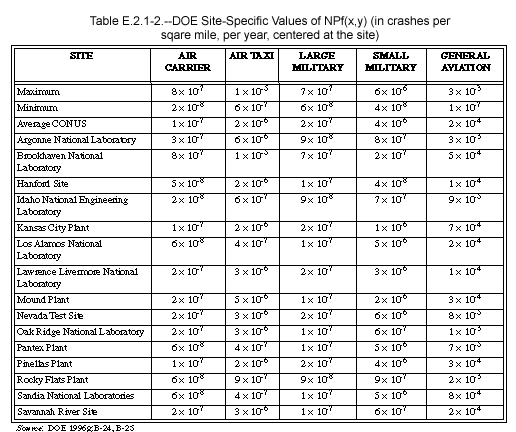
where the product of NP equals the expected number of in-flight crashes per year; f(x,y) is the probability, given the crash, that the crash occurs in a 1-square mile area surrounding the given facility; and A is the effective area of the facility. Combined, the product of NPf(x,y) is equivalent to the expected number of crashes per square mile per year in the vicinity of the given site. Table E.2.1-2 gives NPf(x,y) values for selected DOE sites. Also included in this table are minimum, average, and maximum values for facilities at other locations within the continental U.S. (CONUS). The values presented in this table are based on an analysis of the locations of crashes that have occurred in the past in the CONUS. Over 1,000 general aviation crashes were recorded, but available data for air carrier and large military aircraft is limited (DOE 1996g:42).
The calculation of impact frequency is slightly different for helicopters. The four-factor equation becomes
FH = NH × PH × (2 / LH) × AH
where L is the average length, in miles, of the flights corresponding to the site-specific overflights.
E.2.2 Calculation of the Impact Area
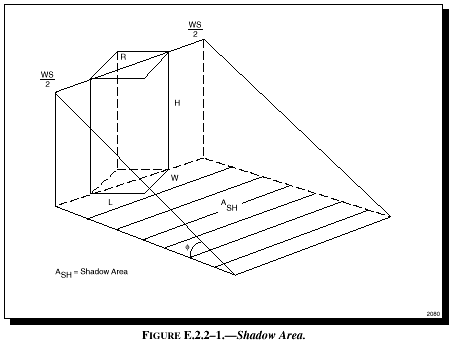
The total effective area (Aeff) required for the probability model is the sum of the true area, the shadow area, and the skid area (DOE 1996g:B-27). It is believed that if an aircraft impact occurs within this total effective area, the structure will be hit either before ground impact or as a result of aircraft skid after impact. In estimating each area, allowance is made for aircraft dimension (i.e., wingspan).
The true area (At) is the base area of the building adjusted for aircraft dimension and is defined as:
At = (2 × L × W × WS) ÷ R + (L × W)
R = (L2 + W2)0.5
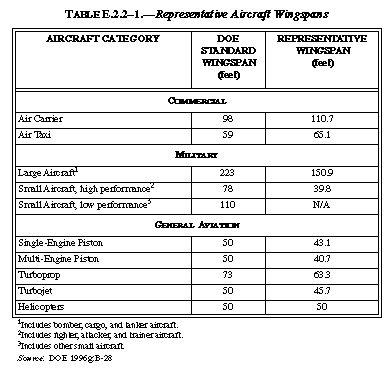
where L is the facility length, W is the facility width, R is the facility hypotenuse, and WS is the aircraft wingspan. In this aircraft accident analysis, DOE Standard wingspans were used for unknown aircraft. Representative wingspans for Near-Airport operations were determined by examining RAMS data and selecting aircraft for each category that represented at least 50 percent of the aircraft category. Both DOE Standard and representative weighted wingspans are presented in Table E.2.2-1.
The shadow area (Ash) is determined from the structure height, the hypotenuse, and the angle of the postulated aircraft impact and is defined as:
Ash = (WS + R) cotf
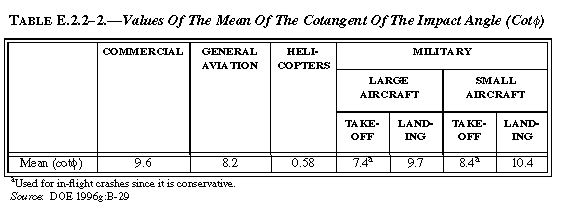
where H is the facility height, WS is the aircraft wingspan, and f is the angle the aircraft path makes with the horizon at impact (Figure E.2.2-1). Values for cot f for the various aircraft categories are presented in Table E.2.2-2.
There is a possibility that an aircraft could impact the ground at some distance from a facility and still strike the structure as a result of skidding into it. The skid area (Askid) is defined as:
Askid = (WS + R) × S
where WS and R are as defined above and S is the skid length. Values for the mean skid distance for each aircraft category are provided in the Draft DOE Standard (DOE 1996g:B-29). The skid distance can be reduced by calculating the critical velocities required to cause damage to a facility. Using the model contained in the Drake Report (Drake 1994), aircraft skid distances can be calculated and subsequently reduced from the mean distances given in the DOE Standard. However, this was not done in this analysis because of two cases encountered:
- Walls covered by enough overburden to stop an incoming missile did not require velocity reduction.
- Walls which are very thin, leading to imminent perforation, were still perforated even after velocity reduction.
E.2.3 Calculation of the Structural Response
The Draft DOE Standard (DOE 1996g) contains a methodology for analyzing a facility's local and global structural response to aircraft crash impact forces. The evaluation of structural response in this EIS is based solely on the local impact forces generated by non-rigid missiles on reinforced concrete and steel constructed facilities. These calculations were used to eliminate certain aircraft from their potential contributions to the overall release frequencies.
Although the global response analysis was not performed, it is not expected to result in significant increases in the estimated frequencies. Release frequencies will always be bounded by impact frequencies. In all cases, consequence calculations assume bounding amounts of material at risk, and as such, consequence calculations remain unaffected by the results of structural response calculations.
Formulas are provided for the impact analysis of both rigid and non-rigid missiles for both reinforced concrete and steel constructed facilities.
E.2.3.1 Reinforced Concrete Targets
Local impacts to facilities include penetration, perforation, and scabbing. Penetration occurs when the missile striking a facility intrudes into the outer surface of the structure. Perforation occurs when the missile punctures a hole all the way through the concrete or steel surface. Scabbing occurs when the missile does not perforate, but does cause concrete to be ejected from the inside face of the target into the facility.
The local response equations used for this calculation are referred to as the Chang equations for rigid missile penetration of reinforced concrete targets (DOE 1996g:60).
Scabbing
ts = [1.84 × (U ÷ V)0.13] × {(MV2)0.4 ÷ [D0.2 × (f'c) 0.4]}
where:
U = reference velocity = 200 ft/sec
V = missile impact velocity (ft/sec)
M = mass of missile = W/g
where W = missile weight (lb) and
g = 32.2 ft/sec2
D = effective missile diameter (ft)
f'c< = ultimate compressive strength of concrete (lb/ft2)
ts = scabbing thickness (ft)
To prevent scabbing, the minimum thickness of the concrete should be ³ 1.1ts (DOE 1996g:62). Because the missiles considered in this analysis are aircraft engines, they are considered non-rigid. As a result, and in accordance with the Draft DOE Standard, the value obtained for rigid missiles can be reduced to 60 percent (DOE 1996g:64).
Perforation
tp = (U ÷ V)0.25 × (MV2 ÷ Df' c)0.5
To prevent perforation, the minimum thickness of the concrete should be ³ 1.2tp (DOE 1996g:62). Similarly, because the missiles in this analysis are aircraft engines which are considered non-rigid, the value obtained for rigid missiles can be reduced to 70 percent (DOE 1996g:64).
E.2.3.2 Steel Targets
The equation used for this calculation is the Ballistic Research Laboratory (BRL) formula for rigid missile penetration of steel targets (DOE 1996g:65).
Perforation
T1.5 = 0.5MV2 ÷ 17,400KsD1.5
where:
T = perforation depth (in)
M = W/g missile mass (lbs-sec2/ft)
V = missile impact velocity (ft/sec)
Ks = constant depending on the grade of steel (usually approx. = 1)
D = missile diameter (in)
To prevent perforation of steel targets, the minimum thickness td should be > 1.25T (DOE 1996g:65).
E.2.3.3 Overburden
In addition to the above equations, an equation exists to allow calculation of a reduced missile velocity as the result of contact with earth overburden. This reduced velocity was calculated as follows (PC 1995d):
Vi = Vo × exp {(pACst) ÷ W}
where:
Vi = reduced missile velocity as a result of earth overburden (ft/s)
Vo = velocity of missile before contact with earth overburden (ft/s)
A = effective area of missile (ft2)
W = maximum weight of missile (engine shaft) for the category of aircraft (lbs)
Cs = speed of sound in soil (ft/s)
= {(Es × g) ÷ p}0.5
t = time (s) = 4 × (d ÷ Vo1.25)
d = depth of soil overburden (ft)
p = density of soil = 130 lbs/ft3
Es = soil modulus of elasticity = 470,000 lb/ft2
g = acceleration due to gravity = 32.2 ft/sec2
For reinforced concrete, a determination is made as to whether the missile perforates or scabs the facility. The steel target equations allow determination of perforation only.
E.3 SITE ANALYSIS
Sites to be analyzed include those that have been selected as possible alternative sites for plutonium pit storage: Pantex Plant, the Manzano Weapons Storage Area (WSA) at Kirtland Air Force Base (KAFB), the Nevada Test Site (NTS), the Savannah River Site (SRS), and the Hanford Site.
E.3.1 Pantex Plant
Pantex Plant is located about 27 kilometers (17 miles) northeast of Amarillo, Texas, approximately 13.6 kilometers (8.5 miles) from the northeast-southwest runway at the Amarillo International Airport. There is a prohibited airspace extending to 1,460 meters (4,800 feet) above mean sea level (MSL) directly above Pantex Plant, which corresponds to 366 meters (1,200 feet) above ground level (AGL).
The principal instrument approaches to the Amarillo International Airport are provided by two methods: an Instrument Landing System (ILS) and a Very High Frequency Omni Directional Radio Range with Tactical Air Navigation (VORTAC), a regional air navigational aid. The main approach uses the azimuth portion of the runway's ILS signals, called the Back Course Localizer (BCL) (Figure E.3.1-1). Any aircraft using full instrument approach to the main runway (Runway 4/22) follows a path that takes it over the Plant's boundaries at an altitude of approximately 1,460 meters (4,800 feet).
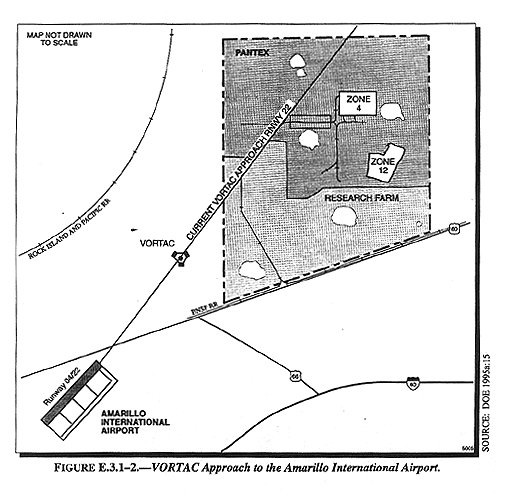
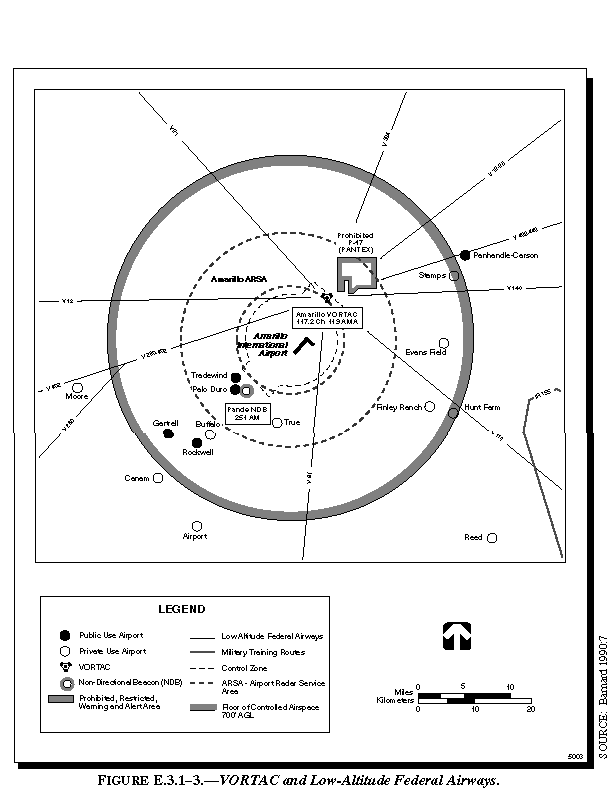
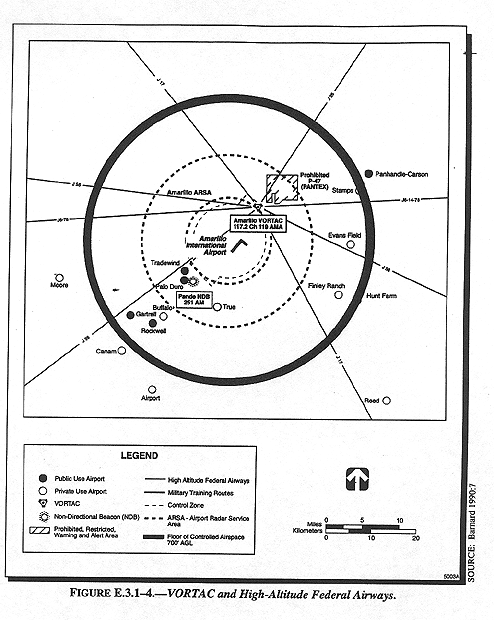
The VORTAC is 8 kilometers (5 miles) west of Pantex Plant. An approaching aircraft using the VORTAC also follows a path that also takes it over the Plant's boundaries (Figure E.3.1-2). Thus, air traffic in each of the nine low-altitude and eight high-altitude air corridors serviced by the VORTAC contributes to air traffic in the vicinity of Pantex Plant (Figures E.3.1-3 and E.3.1-4). There is an additional VORTAC north of the Plant near Borger. Aircraft flying in this high-altitude air corridor were included in data collected for Pantex Plant.
DOE and the Federal Aviation Administration (FAA) have signed a Memorandum of Understanding (MOU) to take several actions to reduce the number of flights directly over Pantex Plant. Some of these steps include establishing a Global Positioning System (GPS) route around Pantex Plant, moving the holding pattern for commercial aircraft away from the Plant, and moving the high-altitude VORTAC closer to the airport. The estimated reduction in risk for these changes is discussed in section E.3.1.7.
An estimate of an aircraft crash into any of the Zone 4 magazines and Zone 12 buildings at Pantex Plant was generated using the probability equations defined in section E.2.1, the effective areas defined in section E.2.2, and the structural response in section E.2.3.
E.3.1.1 Radar Airspace Monitoring System Project
The RAMS project is based at the Amarillo International Airport and consists of a computer system that records radar data from various aircraft overflights in the area. This radar data is then translated into data points that represent aircraft positions in relation to the airport and Pantex Plant. RAMS data include individual aircraft types that were divided into the aircraft categories defined in section E.2.1 to ratio the number of aircraft operations at the airport. The RAMS data was used to categorize the aircraft in more detail than the four categories i.e., Air Carrier, Air Taxi, Military, and General Aviation) supplied by FAA.
E.3.1.2 Operations Near Pantex Plant
An adjustment to the Near-Airport Model consisted of manipulation of the aircraft modes (i), aircraft categories (j), and flight sources (k) to model Pantex Plant conditions. The aircraft mode, i, was summed over three phases:
i = 1 Take-off
i = 2 In-Flight
i = 3 Landing
The aircraft categories are very similar to those presented in section E.2.1.
j = 1 Commercial: Air Carrier
j = 2 Commercial: Air Taxi
j = 3 Military: Large (Bomber, Cargo, and Tanker aircraft)
j = 4 Military: Small (Attack, Fighter, and Trainer aircraft)
j = 5 General: Fixed-wing, reciprocating, single-engine
j = 6 General: Fixed-wing, reciprocating, multi-engine
j = 7 General: Fixed-wing, turboprop
j = 8 General: Fixed-wing, turbojet
j = 9 Helicopters
The flight source, k, was set equal to five flight sources.
k = 1 Runway 22
k = 2 Runway 04
k = 3 Runway 31
k = 4 Runway 13
k = 5 Non-Airport Aircraft
It was determined that the following commercial aircraft are used at the Amarillo International Airport:
- American Airlines
- - F100 (Fokker 100; 90+ passenger capacity)
- - SF340 (Saab; approximately 35-passenger capacity)
- - AT72 (ATR72; approximately 66-passengercapacity)
- Delta Air Lines
- - AT72 (ATR72; approximately 66-passenger capacity)
- - E120 (Brasilia; approximately 30-passenger capacity)
- United Airlines
- - E120 (Brasilia; approximately 30-passenger capacity)
- Southwest Airlines
- - 737 (Boeing; 100+ passenger capacity)
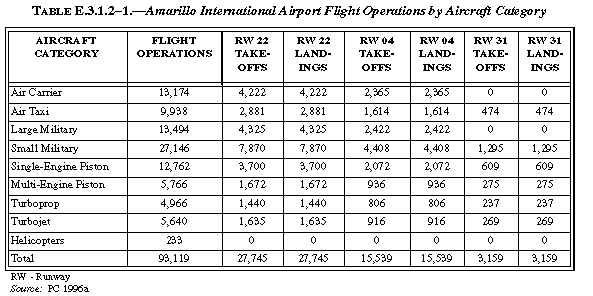
In this analysis, 1995 data obtained from the FAA indicate that there are approximately 74,911 operations per year at the Amarillo International Airport. The FAA supplied data for air carrier, air taxi, military, and general aviation aircraft, with 11,122; 7,134; 30,386; and 26,269 operations, respectively (PC 1995). Based on RAMS data, there were 233 helicopter operations in 1995.
Since the number of annual aircraft operations has been as high as 88,489 in 1992, the maximum number of operations from 1990 to 1996 were used in the analysis for each FAA aircraft category. Maximum values for air carrier, air taxi, military, general aviation, and helicopter operations are 13,174 (1990); 9,938 (1993); 40,638 (1993); 29,134 (1992); and 233 (1995), respectively.
FAA commercial and general aviation operations numbers do not include the number of times a commercial or general aviation may circle during a holding pattern, but holding patterns have been included in the crash rates for commercial and general aviation. The FAA number for military operations includes touch-and-go operations (PC 1995c). RAMS data were used to divide military and general aviation FAA data into aircraft categories (i.e., large or small military, and single-engine, multi-engine, turboprop, or turbojet general aviation).
Approximately 12 months of RAMS data were used to identify and categorize aircraft by type (DOT 1994; DOT 1985; LLNL 1995). The percentage of operations, using the RAMS data, was derived from the four sets of FAA data (i.e., air carrier, air taxi, military, and general aviation). The total number of operations was obtained by multiplying the percentage of RAMS operations for each aircraft category by the FAA data for each category.
The total number of operations that could occur on Runway 31 is the same as the total number of operations for each category except for air carrier and large military, which include aircraft that are too heavy to use Runway 31. The percentage of operations that occur on Runway 31 (6.8 percent) was obtained by evaluating a statistical sample of RAMS data and counting the number of operations on each runway (PC 1995a). The percentage of operations that land on Runway 22 (64.1 percent) versus take-off on Runway 04 (35.9 percent) was determined based on prevailing winds (Figure 4.7.1.1-1 in volume I). Table E.3.1.2-1 presents the number of operations for each aircraft category for Runways 04, 22, and 31.
In addition to FAA operations data, in the Near-Airport Model, in-flight aircraft at high altitudes were considered as Non-Airport operations in the Draft DOE Standard (DOE 1996g) methodology. The evolution of high-altitude aircraft is based on the DOE Standard NPf(x,y) values for Pantex Plant. All high-altitude overflights are assumed to be in-flight. The calculation of this impact frequency is performed using the equation discussed in section E.2.1.
E.3.1.3 Crash Density Function Near Pantex Plant
Because Zones 4 and 12 are within the aircraft category dependent exclusion distance from the Amarillo International Airport, the air operations of interest for this analysis are take-off, landing, and in-flight modes (i.e., i =1, 2, 3). Therefore, the probability equation becomes:

The length of Runway 04/22 at the Amarillo International Airport is 4.12 kilometers (2.56 miles). It was assumed from the direction of the prevailing winds that Runway 22 is used 64.1 percent of the time (Figure 4.7.1.1-1 in volume I). Due to the aircraft category dependent exclusion distance, all aircraft considered as an airport operation on Runway 04/22 were either in the take-off or landing mode. For all runways, the pattern side for military operations was conservatively assumed to be the value for the side with the larger probability density function (pdf), since there is no dominant pattern at the Amarillo International Airport. For all runways, 50 percent of operations are take-off and 50 percent are landing.
The length of Runway 13/31 is 2.41 kilometers (1.50 miles). Approximately 6.8 percent of daily operations occur on Runway 13/31. Because Runway 13 has only about one operation per day, all operations on the runway were assumed to occur on Runway 31. Due to weight restrictions, air carrier and large military aircraft cannot use Runway 31. For this runway, all aircraft considered as an airport operation were either in the take-off or landing mode.
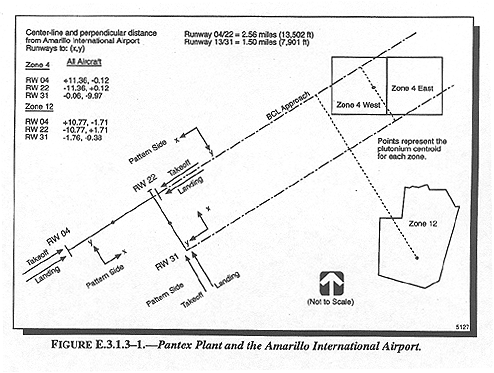
The center-line and perpendicular distances from the geometric center of the runway to specific points of concern in Zones 4 and 12 were determined as shown in Figure E.3.1.3-1 (USGS 1953; USGS 1953a; USGS 1973; USGS 1956). Because Pantex Plant resides within the aircraft category dependent exclusion distances, a Near-Airport Analysis was required and probability density function values were used in this analysis.
Figure E.3.1.3-1 (not to scale) represents the location of Pantex Plant facilities in relation to Runways 22/04 and 31/13 at the Amarillo International Airport. There are two key areas on this figure that are considered in assessing the aircraft impact probability:
- A 1-mile by 1-mile grid area encompassing most of Zone 4 West located southeast of the runway center-line.
- A 1-mile by 1-mile grid area adjacent to the first and encompassing all of Zone 12.
The aircraft impact probability assessment focuses on accidents in the vicinity of these areas; in particular the nearest facility for each of these zone areas. The assessment was performed by separating the displacement vector from the geometric center of the runway to specific points in the zone grids into two orthogonal components:
- Vector coincident with a direct projection of the center-line of the runway.
- Vector perpendicular to the first that extends from the first vector to the nearest impact point in the area. For Pantex Plant, this point represents the plutonium centroid of Zones 4 and 12 (refer to Figure E.3.1.3-1).
The lengths of these two vector components were used to implement the Near-Airport Model methodology. It was assumed for simplicity that all of the Zone 4 West magazines reside in the grid under consideration.
The NPf(x,y) values provided in the Draft DOE Standard (DOE 1996g) for the various aircraft categories reflect the crashes per square mile, per year, centered at a given site for non-airport operations. In this analysis, the following NPf(x,y) values for Pantex Plant were used (DOE 1996g:B-24, B-25):
NPf(x,y) General Aviation = 7 × 10⁻⁵
NPf(x,y) Air Carrier = 6 × 10⁻⁸
NPf(x,y) Air Taxi = 4 × 10⁻⁷
NPf(x,y) Large Military = 1 × 10⁻⁷
NPf(x,y) Small Military = 5 × 10⁻⁶
The NPf(x,y) value for general aviation was split between the four general aviation categories for Pantex Plant based on the RAMS data. The value was divided up based on the following percentages:
Single-engine piston = 43.8% Þ 3.1 × 10⁻⁵
Multi-engine piston = 19.8% Þ 1.4 × 10⁻⁵
Turboprop = 17.0% Þ 1.2 × 10⁻⁵
Turbojet = 19.4% Þ 1.4 × 10⁻⁵
According to the Draft DOE Standard, it has been shown, based on helicopter crash data, that the contribution to impact frequency from non-local helicopter overflights is insignificant and need not be considered in the impact frequency calculations (DOE 1996g:45). However, it is necessary to consider local helicopter flights that consist of planned overflights dealing with facility operations, or flights dealing with area operations (e.g., Southwestern Public Service powerline maintenance flights), using the equation discussed in section E.2.1.
E.3.1.4 Zone 4
In this analysis, only facilities that contain plutonium and large amounts of tritium were considered, as determined in previous hazard assessments, since these materials have possible offsite consequences (Jacobs 1993; Jacobs 1993a; Jacobs 1992).
Area Calculation
To estimate the overall probability of aircraft impact into any magazine in Zone 4, the probability of striking an individual magazine or group of magazines is summed appropriately over the individual magazines or groups of magazines analyzed (i.e., 18 Modified Richmond (MR) magazines, 9 groups of 3 Steel Arch Construction (SAC) magazines, and 3 groups of 5 SAC magazines). The total effective area is the sum of the true areas (the magazine base area adjusted for aircraft dimension), the shadow areas (defined by the magazine height and the angle of postulated impact), and the skid areas (the area covered by a skidding aircraft after impact with the ground) posed by all 60 magazines in Zone 4.
The MR magazines were considered as single structures (18 total), while the SAC magazines were analyzed as 9 groups of 3 (27 total) and 3 groups of 5 (15 total). The distance between the SAC magazines in the groups was included in the value used for the length of the group because this length gave a better representation of the possible area of impact.
The following section illustrates the calculation of the individual areas and the effective area for the groups of three SAC magazines. In this calculation, the magazines were assumed to be in a position (e.g., east row on Figure 4.15.1.1-1 in volume I) that allows the longest skid distance prior to impact with a magazine.
An aircraft that impacts the ground prior to reaching a line of magazines, (i.e., in a skid mode) can impact one line of magazines, but is precluded from reaching the second. The effective areas for one line of magazines (and the five isolated MR magazines) were estimated using the mean skid distances presented in the Draft DOE Standard (DOE 1996g:B-29). However, the skid distances for magazines in the second line were reduced to no more than the distance between the two rows of magazines (125 meters [410 feet]) (Figure 4.15.1.1-1 in volume I). This reduced distance affects commercial and military aircraft only. In addition, the shadow area of the first row was eliminated since it is part of the skid area of the second row. The angle of impact was chosen based on the values presented in the Draft DOE Standard (DOE 1996g:B-29).
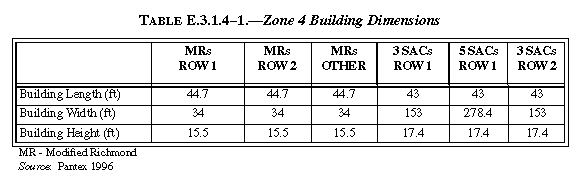
A total effective area for the Zone 4 magazines was then computed by combining the effective areas in the following manner. The effective area for magazines in the east row is the sum of the effective areas for three groups of three SAC magazines, three groups of five SAC magazines, and six MR magazines. The effective area for magazines in the west row is the sum of the effective areas for six groups of three SAC magazines and seven MR magazines. All of these effective areas were computed using the 125-meter (410-foot) inter-row separation as the skid distance for air carrier and military aircraft. The total effective area for Zone 4 is the sum of the effective areas for the east and west rows plus the effective areas of the five MR magazines on the west side of Zone 4. Table E.3.1.4-1 presents the Zone 4 building dimensions.
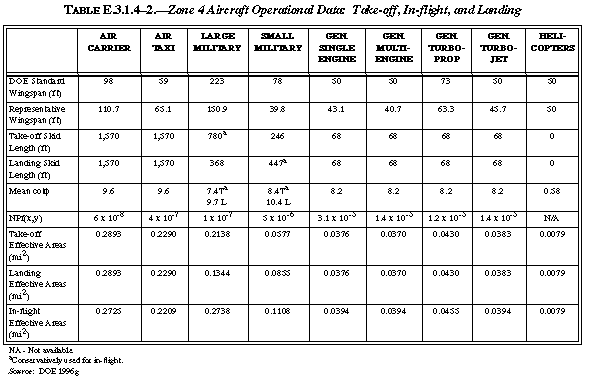
Table E.3.1.4-2 presents the aircraft operational data used for the Zone 4 analysis. In this table, both the Draft DOE Standard and representative wingspans for aircraft in the vicinity of Pantex Plant are given. Representative wingspans were determined by examining RAMS data and selecting aircraft for each category that represented the average of the aircraft (for the commercial and military aircraft categories, over 96 percent of the aircraft were included). Weighted average wingspans were then used in the calculations (Jane's 1961-1996). The skid length used corresponds to the skid distances presented in the Draft DOE Standard (DOE 1996g:B-29).
Hit Probability Calculation
Using the coordinate convention, the center-line (x distance) and perpendicular distances (y distance) to the plutonium centroid for Zone 4 are:
| Zone 4 | All Aircraft |
| Runway 04 | 11.36 mi, -0.12 mi |
| Runway 22 | -11.36 mi, 0.12 mi |
| Runway 31 | -0.06 mi, -9.97 mi |
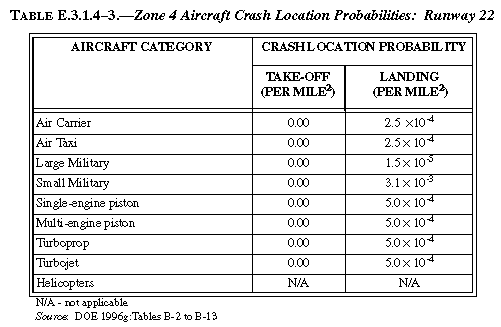
Based on these distances, all aircraft using the Amarillo International Airport were analyzed using the Near-Airport Model. The crash location probabilities for Runway 22 are presented in Table E.3.1.4-3 (DOE 1996g:B-12-B-23). The air carrier and air taxi crash location probabilities are identical because their crash density location probabilities are grouped into a commercial category. The crash location probabilities are zero for Runway 22 take-offs because in this analysis all take-offs are in a direction away from Pantex Plant, and thus are not a threat to the plant facilities.
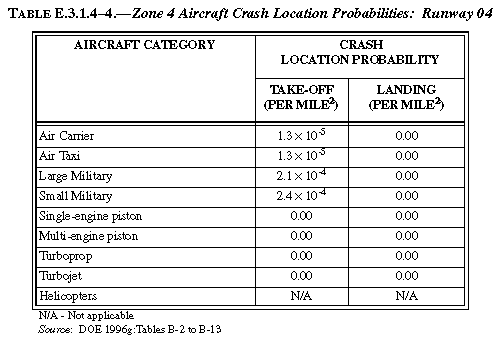
The crash location probabilities for Runway 04 are provided in Table E.3.1.4-4 (DOE 1996g:B-12-B-23). Both the air carrier and air taxi crash location probabilities are identical because their crash location probabilities are grouped into a single commercial category.
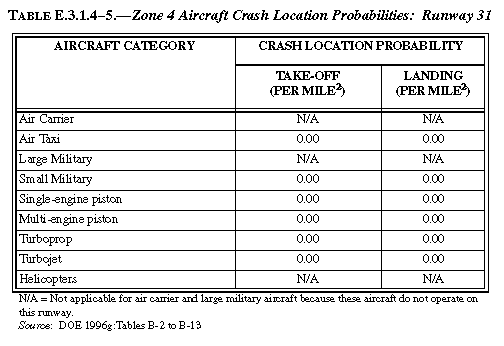
The crash location probabilities for Runway 31 are presented in Table E.3.1.4-5 (DOE 1996g:B-12-B-23). Likewise, the air carrier and air taxi crash location probabilities are also identical because their crash location probabilities are grouped into a single commercial category.
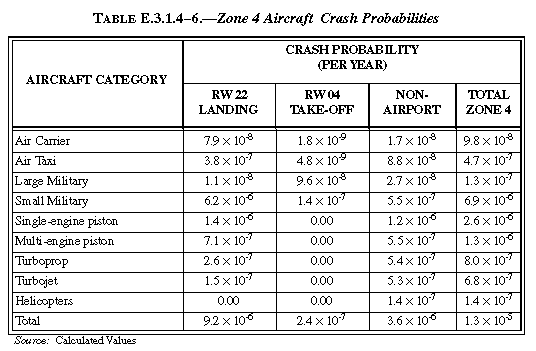
The impact probability was obtained for the entire Zone 4 storage area by multiplying the number of flights, the impact area, the crash rate, and the crash density function for each category. With substitution of the above data into the probability equation for the specific aircraft type, the impact probabilities for Zone 4 were calculated. Table E.3.1.4-6 contains the crash probabilities for Runway 22 landings, Runway 04 take-offs, and the non-airport aircraft. Runway 31 crash probabilities are omitted because they are all zero.
Structural Calculation
For this analysis, 70th percentile velocities of aircraft were used (LLNL 1995:2-24, 3-81, 4-25, 4-26). The velocities chosen were in either take-off or landing operations, whichever was the largest. For facilities with earth overburden, these velocities were reduced according to the earth overburden velocity reduction equation previously defined.
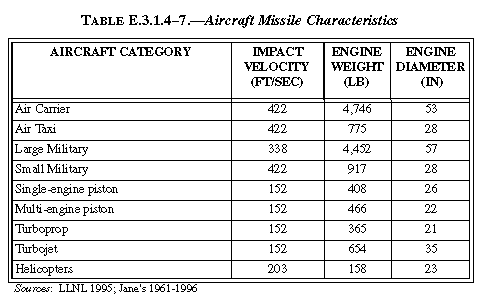
The local response equations for rigid missiles impacting reinforced concrete structures were applied to the MR magazines, and the local response steel equations for rigid missiles were applied to the SAC magazines. A reduction in penetration depth was taken because the missiles were non-rigid. In this analysis, the aircraft engine was investigated as the missile of concern. These engines were treated in the equations as non-rigid missiles. Table E.3.1.4-7 presents representative engine weights and diameters for aircraft landing and taking off at the Amarillo International Airport. Representative engine weights and diameters were determined by examining RAMS data and selecting aircraft for each category that represented the average of the aircraft. Weighted average engine weights and diameters were then used in the structural calculations.
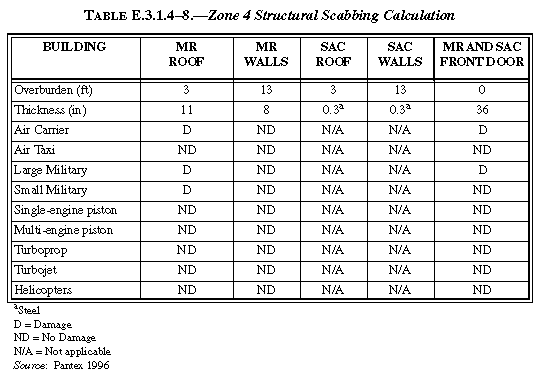
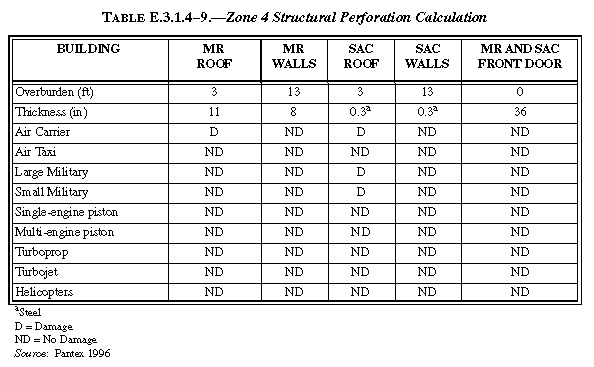
Local response structural calculations were performed for five different sets of overburdens and building thicknesses. These include the MR magazine roof and walls, the SAC magazine roof and walls, and the front doors of both magazine types. Since only the magazine entry barrier was modeled, doors for the SAC and MR magazines are the same. The roof and walls for both types of facilities were modeled separately since there is substantially greater overburden on the walls compared to the roof. The front face was modeled assuming the large security barrier was in place. Table E.3.1.4-8 presents the results for either perforation or scabbing for each of the five different sets. Similarly, Table E.3.1.4-9 presents the results for perforation.
Perforation and Scabbing Probability Calculations
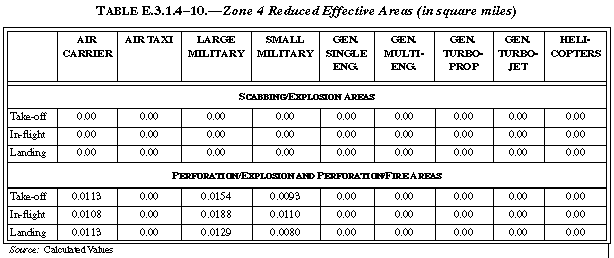
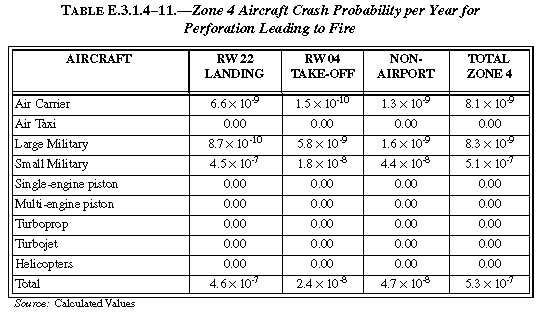
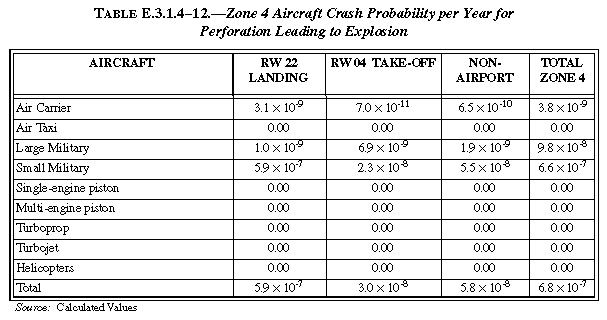
For facilities with high explosives (HE) (weapons), the bounding accident is a perforation or scab leading to an explosion. For facilities without HE, the bounding accident is a perforation leading to a fire. Scabbing leading to an explosion is not possible in Zone 4 since material with HE is stored in SACs which cannot scab. The areas for the facilities were reduced using the structural analysis results. The reduced areas were then used to recalculate perforation and scabbing probabilities. These areas are shown in Table E.3.1.4-10, and used to calculate the perforation leading to a fire probabilities shown in Table E.3.1.4-11 and the perforation leading to an explosion probabilities shown in Table E.3.1.4-12.
The combined perforation and scabbing probabilities were used to calculate an explosion probability, since either perforation or scabbing could cause an explosion. For the case where no HE is present, the model was used to calculate the probability of a perforation leading to a fire. The true, shadow, and skid areas for the Zone 4 facilities were reduced for perforation or scabbing based on the following (see Tables E.3.1.4-8 and E.3.1.4-9):
- If the MR magazine roof is "ND" (no damage), then the true and shadow areas are reduced to 0.0.
- If the MR magazine walls are "ND", then the shadow and skid areas are reduced to the width of the building times the skid distance (damage can only occur through the front wall).
- Similarly, if the SAC magazine roof is "ND", then the true and shadow areas are reduced to 0.0.
- Similarly, if the SAC magazine walls are "ND", then the shadow and skid areas are reduced to the width of the building times the skid distance (damage can only occur through the front wall).
- If the MR or SAC magazine front door is "ND", then the skid area is 0.0.
E.3.1.5 Zone 12
The analysis performed for Zone 12 of Pantex Plant was virtually identical to that for Zone 4. The number of airport operations on Runways 22, 04, and 31 discussed in section E.3.1.4 and aircraft wingspans and crash rates used in the Zone 4 analysis were used in the Zone 12 analysis. Zone 12 facilities of concern to aircraft crash are those containing plutonium and large amounts of tritium as determined in previous hazard assessments, since these materials have possible offsite consequences (Jacobs 1993; Jacobs 1993a; Jacobs 1992).
Area Calculation
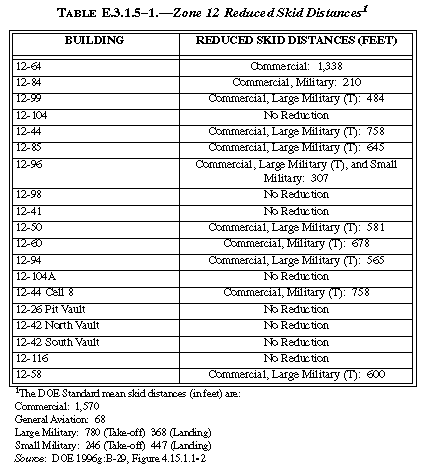
The following section illustrates the calculation of the individual areas and the effective area for the Zone 12 buildings. In this calculation, the buildings were assumed to be in a position that allows the longest skid distance prior to impact with a building (see Figure 4.15.1.1-2 in volume I). As an exception to using the skid distances provided in the Draft DOE Standard (DOE 1996g), for Zone 12, the skid distance was reduced to the maximum distance to nearby buildings when nearby buildings shield the particular facility. The skid distances are presented in Table E.3.1.5-1, as well as the reduced skid distances to account for shielding.
A total effective area for the Zone 12 buildings was then computed by combining the effective areas. The angle of impact was assumed to be that given in the Draft DOE Standard for the various aircraft types. Table E.3.1.5-2 presents the Zone 12 building dimensions.
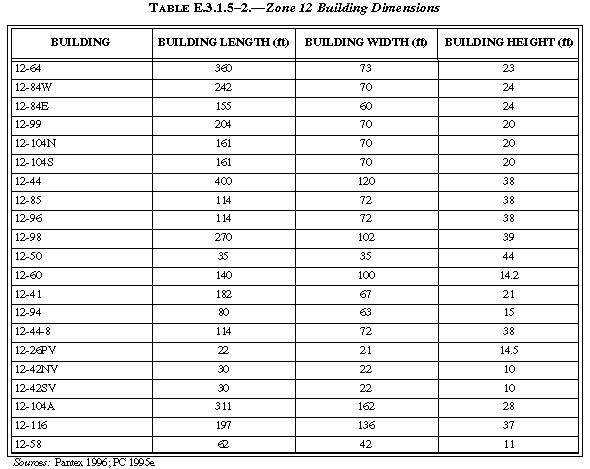
Table E.3.1.5-3 presents the aircraft operational data used for the Zone 12 analysis. In this table, both the Draft DOE Standard and representative wingspans for aircraft in the vicinity of Pantex Plant are provided. Representative wingspans were determined by examining RAMS data and selecting aircraft for each category that represented the average of the aircraft (for the commercial and military aircraft categories, over 96 percent of the aircraft were represented). Weighted average wingspans were then used in the calculations. The skid length used corresponds to the mean skid distances presented in the Draft DOE Standard (DOE 1996g:B-29).
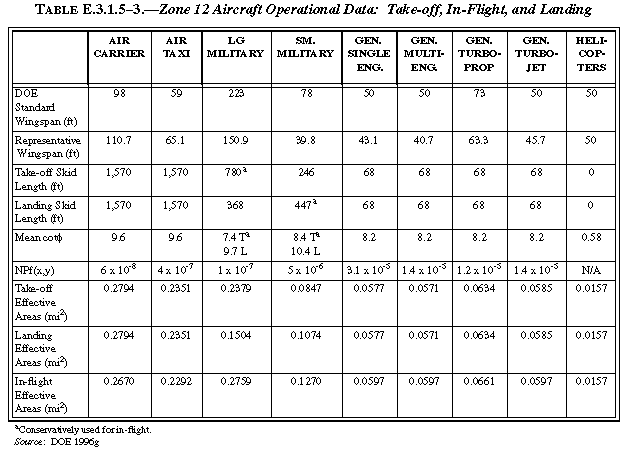
Hit Probability Calculation
Using the coordinate convention, the center-line (x distance) and perpendicular (y distance) distances to the plutonium centroid for Zone 12 are:
| Zone 12 | All Aircraft |
| Runway 04 | 10.77 mi, -1.71 mi |
| Runway 22 | -10.77 mi, 1.71 mi |
| Runway 31 | -1.65 mi, -9.38 mi |
Based on the above distances, all aircraft using the Amarillo International Airport were analyzed with the Near-Airport Model. The crash location probabilities for Runway 22 are presented in Table E.3.1.5-4 (DOE 1996g:B-12-B-23). Air carrier and air taxi crash location probabilities are identical because their crash density location probabilities are grouped into a commercial category. The crash location probabilities are zero for Runway 22 take-offs because in this analysis all take-offs are in a direction away from Pantex Plant, and thus are not a threat to Plant facilities.
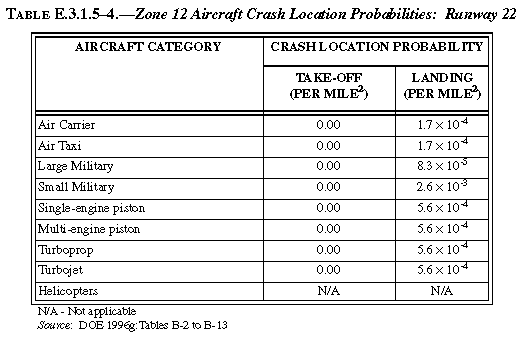
The crash location probabilities for Runway 04 are presented in Table E.3.1.5-5 (DOE 1996g:B-12-B-23). The air carrier and air taxi crash density location probabilities are identical because their crash location probabilities are grouped into a commercial category.
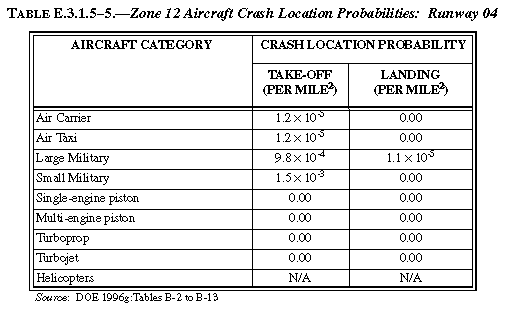
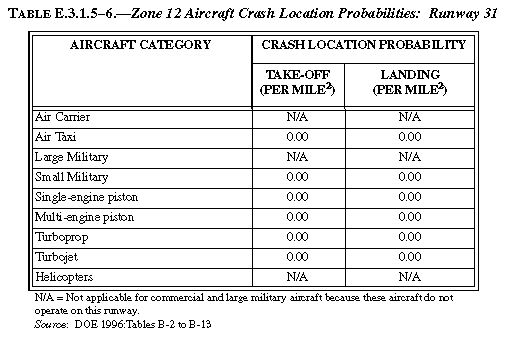
The crash location probabilities for Runway 31 are presented in Table E.3.1.5-6 (DOE 1996g:B-12-B-23). Similarly, both the air carrier and air taxi crash density location probabilities are identical because their crash location probabilities are also grouped into a single commercial category.
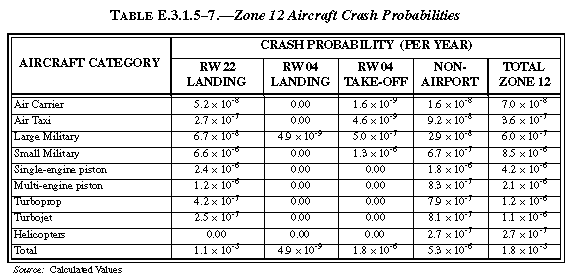
The impact probability was obtained for the entire Zone 12 operations area by multiplying the number of flights, the impact area, the crash rate, and the crash density function for each category. With substitution of the above data into the probability equation for the specific aircraft type, the impact probabilities for Zone 12 were calculated. Table E.3.1.5-7 contains the crash probabilities for Runway 22 landings, Runway 04 take-offs, Runway 04 landings and the non-airport aircraft. Runway 31 crash probabilities are omitted because they are all zero.
Structural Calculation
The same local response equations for concrete and steel structures used in the Zone 4 analysis were used in this analysis. Building 12-60 is a steel arch construction building and was treated as such. Building 12-41 is constructed with clay tile walls and perforation was assumed to occur for all aircraft types.
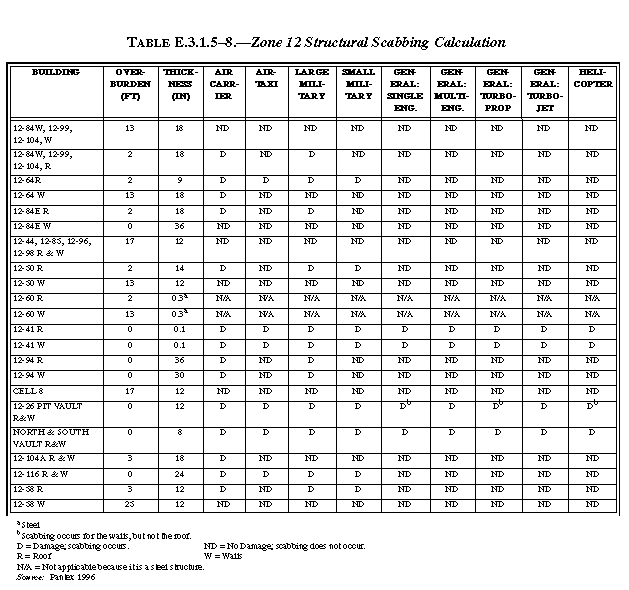
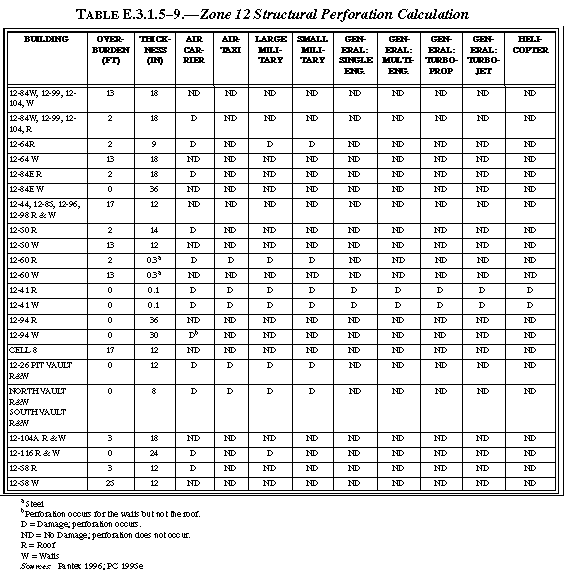
Local response structural calculations were performed for 15 different sets (roofs and walls modeled separately) of overburdens and building thicknesses. These include 12-64, 12-84 West (grouped with 12-99 and 12-104), 12-84 East, 12-44 (grouped with 12-85, 12-96, and 12-98), 12-41, 12-50, 12-60, 12-94, 12-104A, 12-26 Pit Vault, 12-42 North Vault, 12-42 South Vault, 12-44 Cell 8, 12-58, and 12-116. Table E.3.1.5-8 presents the results for either perforation or scabbing and Table E.3.1.5-9 provides the results for perforation.
Perforation and Scabbing Probability Calculations
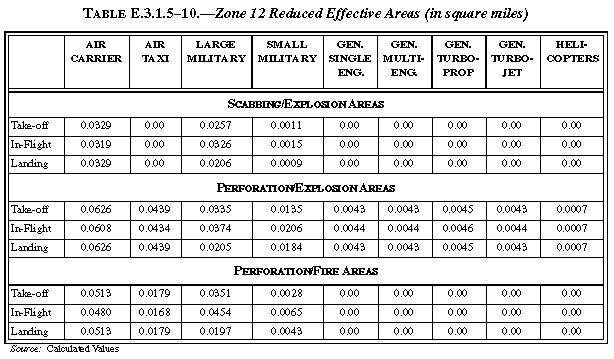
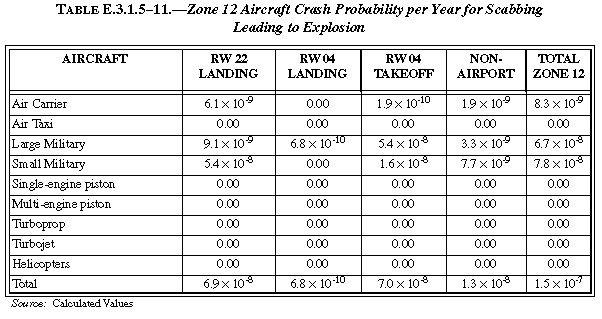
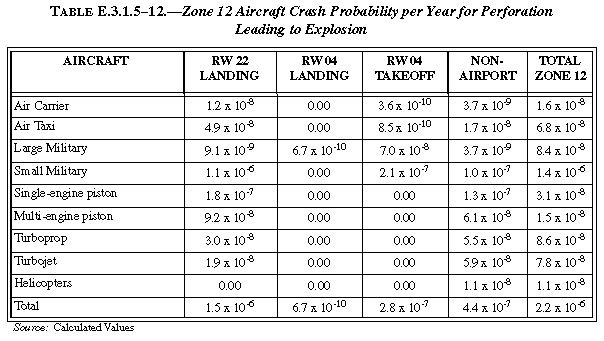
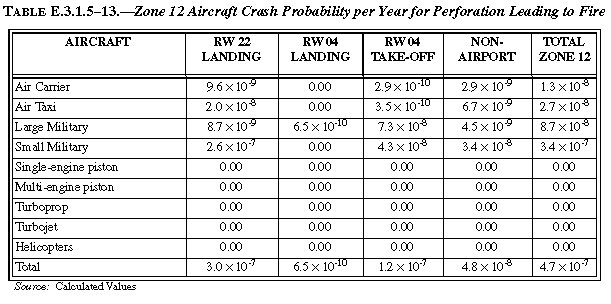
For facilities with HE (weapons), the bounding accident is a perforation or scab leading to an explosion. For facilities without HE, the bounding accident is a perforation leading to a fire. The areas for the facilities were reduced using the structural analysis results. The reduced areas were then used to recalculate perforation and scabbing probabilities. These areas are shown in Table E.3.1.5-10, and used to calculate the scabbing leading to an explosion probabilities shown in Table E.3.1.5-11, the perforation leading to an explosion probabilities shown in Table E.3.1.5-12, and the perforation leading to a fire probabilities shown in Table E.3.1.5-13.
The combined perforation and scabbing probabilities are used to calculate an explosion probability, since either perforation or scabbing could cause an explosion. For the case where no HE is present, the model was used to calculate the probability of a perforation leading to a fire. The true, shadow, and skid areas for the Zone 12 facilities were reduced for perforation or scabbing based on the following ("ND" denotes no damage. See Tables E.3.1.5-8 and E.3.1.5-9):
- If the 12-64, 12-84 W, 12-99, 12-104 roofs are "ND", then the true and shadow areas are reduced to 0.0.
- If the 12-64 walls are "ND", then the skid area is reduced to the width of the building times the skid distance (damage can only occur through the front).
- If the 12-84 E roof and walls are "ND", then the true and shadow areas are reduced to 0.0 and the skid area is reduced to the width of the building times the skid distance (damage can only occur through the front).
- If the 12-44, 12-85, 12-96, 12-98 roofs and walls are "ND", then the true, shadow and skid areas are reduced to 0.0.
- If the 12-50 roof is "ND", then the true and shadow areas are reduced to 0.0.
- If the 12-50 walls is "ND", then the skid area is reduced to 0.0 (there are no doors exposed to the skid direction).
- If the 12-60 roof is "ND", then the true and shadow areas are reduced to 0.0.
- If the 12-60 walls is "ND", then the skid area is reduced to 0.0 (there are no doors exposed to the skid direction).
- If the 12-41 roof and walls are "ND", then the true, shadow and skid areas are reduced to 0.0 (since this was a clay tile structure the facility was modeled as having no depth to assure that perforation occurs).
- If the 12-94 roof and walls are "ND", then the true, shadow and skid areas are reduced to 0.0.
- If the Cell 8 roof and walls are "ND", then the true, shadow and skid areas are reduced to 0.0.
- If the 12-26 Pit Vault, 12-42 North Vault, and 12-42 South Vault roofs and walls are "ND", then the true, shadow and skid areas are reduced to 0.0.
- If the 12-116 roofs and walls are "ND", then the true, shadow and skid areas are reduced to 0.0.
- If the 12-58 roofs and walls are "ND", then the true, shadow and skid areas are reduced to 0.0.
- If the 12-104A roofs and walls are "ND", then the true, shadow and skid areas are reduced to 0.0.
E.3.1.6 Consequence Analysis
The probability of an aircraft hitting a facility in Zone 4 and Zone 12 is 1.3 × 10⁻⁵ and 1.8 × 10⁻⁵, respectively, for a total of 3.1 × 10⁻⁵. The probability of damaging a facility by scabbing leading to an explosion in Zone 4 is 0.0 because scabbing is only possible in MR magazines. These magazines are preferentially occupied by pits (no HE present), whereas the SAC magazines are incapable of scabbing because there is no concrete in the roof and walls. In Zone 12, the probability of scabbing is 1.5 × 10⁻⁷, however, a study conducted by Jeff Glover of Mason & Hanger indicates that scabbed material from the missiles of concern do not possess the energy to cause a detonation within Zone 12 (PC 1996).
The probability of damaging a facility by perforation leading to an explosion in Zone 4 and Zone 12 is 6.8 × 10⁻⁷ and 2.3 × 10⁻⁶, respectively, for a total of 3.0 × 10⁻⁶. The probability of damaging a facility by perforation leading to fire for Zone 4 and Zone 12 is 5.2 × 10⁻⁷ and 4.7 × 10⁻⁷, respectively, for a total of 9.9 × 10⁻⁷. This represents a conservative upper bound for the probability of causing a fire or explosion resulting in plutonium dispersal. This conservative upper bound includes the probability that plutonium or tritium is in the facility, that all of the containers fail, that a fire occurs, and that the contents are exposed to the fire. All four of these probabilities are known to be less than 1 but have been conservatively assumed to be 1 for this calculation.
Consistent with the Draft DOE Standard (DOE 1996g), a consequence analysis has been performed for this accident. The consequence analysis is similar to the consequence analysis for other accidents and is provided for Scenarios 3 and 8 in Table 4.14.2.1-3, volume I.
E.3.1.7 Risk Reduction Due to Overflight Working Group Initiatives
Recommendations of the Overflight Working Group are presented in volume I, section 4.15.1.3. DOE has committed to implement the risk reduction measures proposed by this group. Based on the discussion in volume I, section 4.15.7, it is not possible to fully characterize the risk reduction that would result with implementation of the Overflight Working Group initiatives using the current methodology. However, it is estimated that implementation of the MOU, the offset localizer, relocation of the VORTAC, and 65 percent use of GPS non-precision approach tracks would result in an 82 percent cumulative risk reduction (DOE 1995:22). This 82 percent reduction was estimated using the Solomon model. Fortification of areas and structures in which nuclear materials are handled and stored could further reduce the impact of aircraft accidents.
E.3.2 Manzano Weapons Storage Area
The Manzano WSA is located near the Albuquerque International Airport, a major airport whose routine flight operations include many heavy aircraft. The methodology used to assess the aircraft impact probability is very similar to the analysis performed for the Pantex Plant, but in much less detail because there is only one building type to be analyzed
The Manzano WSA is located in the foothills of the Manzano Mountains, approximately 6.5 kilometers (4 miles) southeast of the main (east-west) runway of the Albuquerque International Airport, one of three airports in the vicinity the Manzano WSA. The Albuquerque International Airport is the major commercial airfield in the State of New Mexico; it is the only airport with regular commercial jet service. In addition to its role as a commercial airfield, the Albuquerque International Airport is used by military aircraft at KAFB. In 1994, the Albuquerque International Airport had 220,914 aircraft operations (take-offs and landings) (PC 1996a).
In addition to the Albuquerque International Airport, there are two other airports in the Albuquerque area. Coronado Airport, approximately 19 kilometers (12 miles) to the north-northwest, has two runways used only by general aviation aircraft. Similarly, Alameda Airport, approximately 24 kilometers (15 miles) to the northwest, has two runways used only by general aviation aircraft.
A description of the x and y coordinate system, the category of aircraft operations that occur, and a screening of the probability density function values for the three airports is presented in Table E.3.2-1. An initial screening of the probability density function values for the type of aircraft operations eliminated the Coronado and Alameda Airports. Both of these airports are outside the probability density function boundary for general aviation aircraft and, therefore, were not included in the aircraft crash analysis. Only the Albuquerque International Airport and non-airport (in-flight) aircraft were included in the analysis as required by the Draft DOE Standard (DOE 1996g).
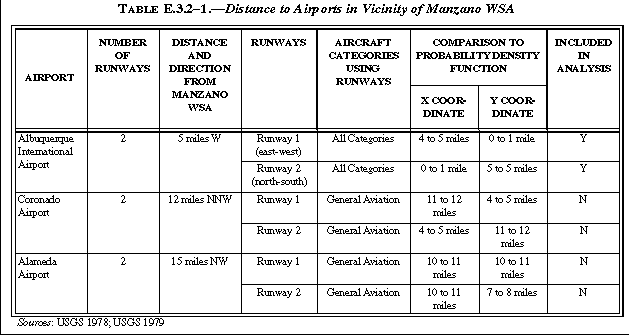
In the history of the Manzano WSA facility, there have been three aircraft crashes. One of the crashes involved an F-100C. The crash occurred east of the Manzano WSA administration area. Another crash involved a B-29 in the northern portion of the site. The aircraft departed from KAFB and crashed after approximately three minutes in flight, killing the crew. The third crash also occurred in the northern portion of the site and involved an EC-135 (KAFB 1993:69,73,74).
A major advantage offered by the Manzano WSA storage facilities is the amount of rock overburden that would shield the stored pits from damage due to aircraft accidents. This overburden is needed because the candidate storage facilities lack an automatic fire suppression system and cannot rely on prompt response from local fire fighters (due to remote facility location and lack of automatic fire detection capability).
If DOE chooses to relocate pits to the Manzano WSA, the pits would be stored in Type D magazines. Type D magazines (as shown in Figure 5.5.1.12-1 in volume I) have access tunnels that vary in length from 20 meters to over 30 meters (65 feet to over 100 feet). The main chambers are approximately 19 meters (61 feet) long and have the capacity to store up to 800 pit containers each in a Stage Right configuration. The main chamber is protected by two vault-like steel doors at both ends of the access tunnel.
Type D facilities are tunneled into the mountainside and thus, provide significant earth overburden protection from penetrating aircraft. As many as 35 magazines have overburden greater than 9 meters (30 feet) and are potentially available for pit storage.
For the 20,000 pit storage option, approximately 25 Type D magazines would be utilized. For the 8,000 pit storage option, approximately 10 Type D magazines would be utilized. The frequency of an aircraft impact at the Manzano WSA is relatively high compared with other potential storage sites. However, the earth overburden of Type D magazine provides significant protection against potential damage from aircraft impacts.
E.3.2.1 Aircraft Crash Affected Environment
An adjustment to the Near-Airport and Non-Airport Models consisted of manipulation of the flight modes (i), aircraft categories (j), and aircraft sources (k) to fit the Manzano WSA site. The flight mode, i, was set equal to three flight modes.
i = 1 Take-off
i = 2 In-flight
i = 3 Landing
The aircraft categories are very similar to Pantex Plant, except helicopters have been omitted because they are not shown to be penetrating missiles.
j = 1 Commercial: Air Carrier
j = 2 Commercial: Air Taxi
j = 3 Military: Large (Bomber, Cargo, and Tanker aircraft)
j = 4 Military: Small (Attack, Fighter, and Trainer aircraft)
j = 5 General: Fixed-wing, reciprocating, single-engine
j = 6 General: Fixed-wing, reciprocating, multi-engine
j = 7 General: Fixed-wing, turboprop
j = 8 General: Fixed-wing, turbojet
Here the aircraft sources, k, was summed over three phases
k = 1 Albuquerque International Airport Runway 1
k = 2 Albuquerque International Airport Runway 2
k = 3 Non-Airport Aircraft
Figure E.3.2.1-1 (not to scale, adapted from JDRC nd) represents the location of the Manzano WSA storage facilities in relation to east-west runway at the Albuquerque International Airport. There are three key points on Figure E.3.2.1-1 that were considered in assessing the aircraft impact probability:
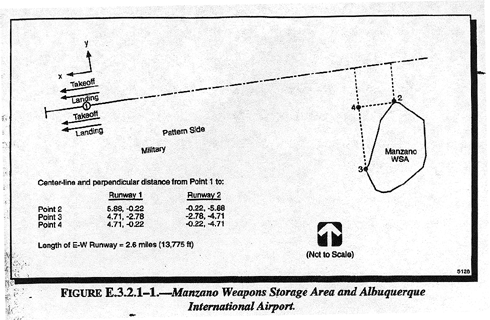
- Point 1, located at the geometric center of the east-west runway;
- Point 2, located at the northern-most end of the candidate storage area;
- Point 3, located at the south western end of the candidate storage area.
The aircraft impact probability assessment focuses on accidents in between points 2 and 3. The assessment was performed by separating the displacement vector from point 1 to both points 2 and 3 into two orthogonal components, a:
- Vector coincident with a direct projection of the center-line of the runway; and
- Vector, perpendicular to the first that extends from the first vector to the impact point (i.e., point 2 or point 3).
The lengths of these two vector components
were used to determine the crash probability density. The length
of the east-west runway at the Albuquerque International Airport
is 4.2 kilometers (2.6 miles) (Smith 1995:9). Using this information,
it was determined that the center-line and perpendicular distances
from point 1 (the midpoint of the runway) to (JDRC nd):
| Runway 1 (east-west) |
Runway 2 (north-south) |
|
| Point 2 |
5.88 miles, -0.22 miles |
-0.22 miles, -5.88 miles |
| Point 3 |
4.71 miles, -2.78 miles |
-2.78 miles, -4.71 miles |
Because none of the Manzano WSA storage facilities have a center-line distance closer than 4.71 miles, nor a perpendicular distance less than 0.22 miles, Point 4 was conservatively adopted for the aircraft frequency assessment.
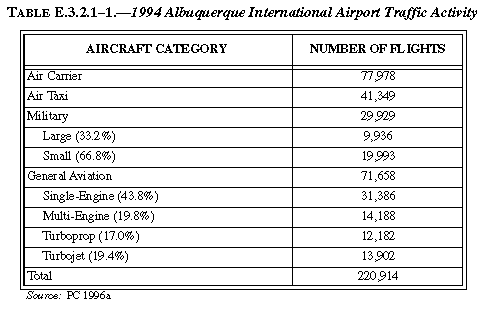
An estimate of an aircraft crash into the Manzano WSA storage facilities was generated using the probability equation defined in Section E.2.1. The south, east, and west are the preferred directions for take-offs and landings at the Albuquerque International Airport (Smith 1995:3). Table E.3.2.1-1 summarizes the 1994 Albuquerque International Airport traffic activity (PC 1996a).
Approximately one-third of the flights at the airport pass in proximity to the Manzano WSA. It was conservatively assumed for this analysis that all of the flights passed in proximity to the Manzano WSA. Since the number of operations included only air carrier, air taxi, military, and general aviation aircraft, the number of military and general aviation operations was divided by the same ratio that was determined for Pantex Plant. While this assumption may not necessarily be accurate, it does not affect the final results for this analysis.
The crash rates values described in section E.2.1 were used in this analysis. The distance to the runway and number of annual flight operations were modeled conservatively in this aircraft impact probability assessment.
Using this information, the probability equation becomes:

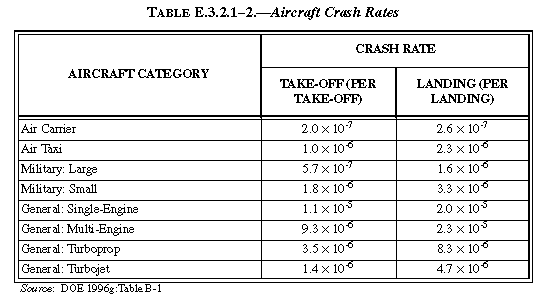
Data in Table E.3.2.1-1 does not differentiate between take-offs and landings. Hence, it was assumed that half of the tabulated operations are take-offs and half are landings. Crash rates are provided in Table E.3.2.1-2.
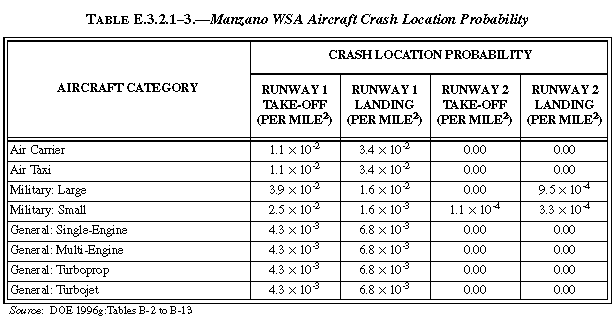
The aircraft crash location probability for each aircraft category and flight mode is presented in Table E.3.2.1-3 (DOE 1996g:B-12 to B-23). Using the coordinate convention in the Near Airport Model, the center-line and perpendicular distances to Point 4, the hypothetical storage facility, are:
| Runway 1 (east-west) | Runway 2 (north-south) | |
| Point 4 | 4.71 miles, -0.22 miles | -0.22 miles, -4.71 miles |
The crash location probabilities in Table E.3.2.1-3 are identical for the air carrier and air taxi categories, and the four general aviation categories, because their crash location probabilities are grouped into a single category each.
The crash location probabilities for general aviation are asymmetrical in the Draft DOE Standard (DOE 1996g). Therefore, in preparing Table E.3.2.1-3, more conservative crash probabilities were used. This conservative convention was also applied to military crash location probabilities.
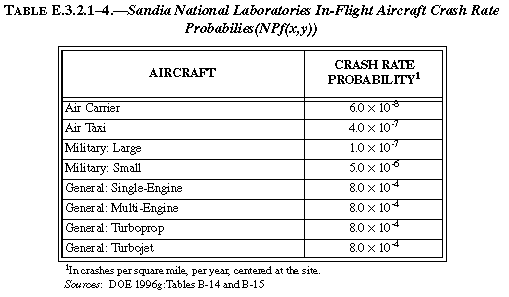
The model for aircraft in-flight was changed from a Solomon Model basis in the July 1995 version of the Draft DOE Standard (DOE 1995z) to the curve-fitted empirical Non-Airport Model in the Draft DOE Standard (DOE 1996g) based on crashes that have occurred throughout the country. The July 1996 Draft DOE Standard includes NPf(x,y) values for each DOE site. Only the area of the facility is calculated. For this analysis, the crash rate probabilities per square mile for Sandia National Laboratories, located north of the east-west runway, were used (Table E.3.2.1-4).
E.3.2.2 Area Calculation
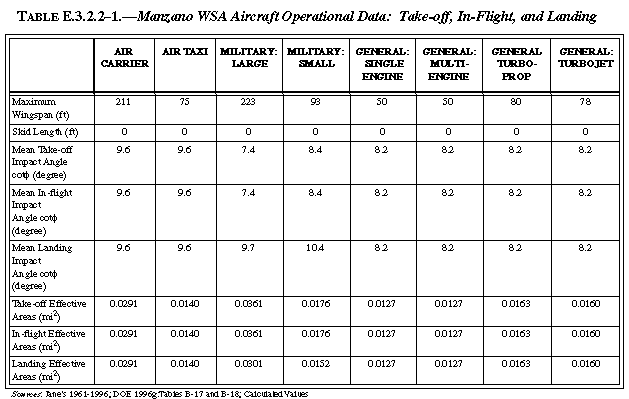
The last parameter in the above probability equation requiring quantification is Aij. The length, width, and height of a Manzano WSA Type D storage facility are: 18.5 meters (60.7 feet), 8.1 meters (26.5 feet), and 3.8 meters (12.5 feet) (Figure 5.5.1.12-1 in volume I). Using the methodology developed above for Pantex Plant for a rectangular facility (which is conservative since the Type D facilities have a stronger, concrete arch design):
At = (2 × L × W × WS) ÷ R + (L × W)
Ash = (WS+R) x H cotf
R = (L2 + W2)0.5
An impact angle, f, dependent on the aircraft category and the flight mode, was used here as was done in the Pantex Plant analysis. The representative maximum wingspan dimensions, WS, for each aircraft category used are also the same.
The total area for the structures does not include the contribution from the skid area because it was assumed that any aircraft skidding along the mountain will skid across the top of storage facilities without damaging them (i.e., no significant forces normal to the rock face will be exerted). Hence, only an impact directly into the storage facility could cause a radionuclide release. The total area for the Manzano WSA storage facilities was obtained by multiplying the individual areas for each aircraft type by 25, the total number of facilities. Table E.3.2.2-1 presents aircraft operational data for take-off, in-flight, and landings used for this analysis.
E.3.2.3 Impact Probability Calculation
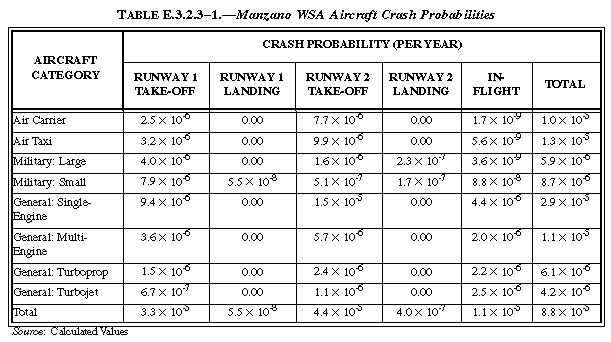
With substitution of the above data into the probability equation, the impact probabilities listed in Table E.3.2.3-1 were obtained. The impact probability was obtained for the entire Manzano WSA by multiplying the individual facility probability by the total number of facilities present. Since the frequency of hitting one of 25 Type D magazines, 8.8 × 10⁻⁵, was greater than 10-7, in accordance with the Draft DOE Standard (DOE 1996g), further analysis was required.
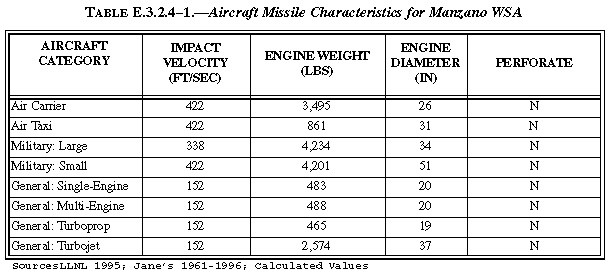
E.3.2.4 Structural Calculation
Given that an aircraft impacts into a Manzano WSA storage facility, there is only a risk to human health if the storage facility is penetrated and the storage containers are damaged sufficiently to release plutonium into the environment. Since the pits will be stored in AT-400A, a certified Type B shipping container, minor damage to the storage facility is not anticipated to cause container failure. However, significant damage to the storage facility is likely to damage containers sufficiently enough to cause a plutonium release.
A survey of Manzano WSA contour maps reveals that the minimum overburden for a facility is approximately 9 meters (30 feet). Therefore, the approach proposed for estimating the penetration probability is to determine if the velocity of the aircraft in take-off and landing modes is sufficient to penetrate 9 meters (30 feet) of rock, and then quantify the probability that the impact is sufficient to cause penetration.
A local response structural analysis was performed according to the Draft DOE Standard (DOE 1996g) for a facility with a 9 meter (30 feet) overburden. The analysis was performed for the maximum penetrator missile for each of the eight aircraft categories. The aircraft penetrators modeled, and if they penetrate the facility, are shown in Table E.3.2.4-1. None of the eight aircraft missiles were capable of penetrating the facility; therefore, the frequency of releasing material from one of the 25 Type D magazines was 0. Since the frequency of releasing material is less than 10-7, in accordance with the Draft DOE Standard, no further analysis was required.
E.3.2.5 Consequence Calculation
The probability of an aircraft hitting a facility at Manzano WSA is 8.8 × 10⁻⁵. The probability of damaging a facility by perforation is 0. Consistent with the Draft DOE Standard (DOE 1996g), a consequence analysis was not necessary.
E.3.3 NEVADA TEST SITE
The airspace above NTS, designated as R4808, is a Special-Use Airspace identified by Federal Aviation Administration regulations. This designation applies to all aircraft and is unlimited in height. Clearance to penetrate the restricted airspace above NTS must be obtained from DOE. Aircraft desiring to fly over NTS airspace are required to contact the DOE Operations Coordination Center at NTS. Requesters must provide information regarding the type of aircraft and nature of flight into the restricted airspace. DOE has approved authority for flights into the restricted airspace. Based on penetration calculations performed for Manzano WSA and 9 meters (30 meters) of soil and rock, the proposed pit storage location inside of P-Tunnel is immune from aircraft accidents since its location is approximately 240 meters (800 feet) below the mesa. Therefore, pits stored in P-Tunnel were not considered for any analysis (PC 1995b).
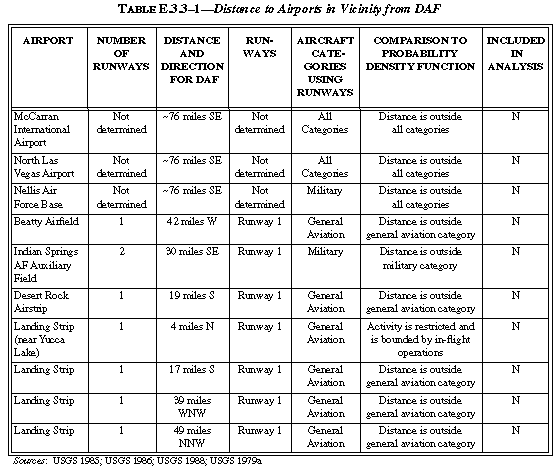
There are four airports and five landing strips in the vicinity of the DAF and P-Tunnel. Las Vegas McCarran International Airport is the major commercial airfield in the State of Nevada; it is the only airport with regular commercial jet service. The airport is located approximately 122 kilometers (76 miles) southeast of NTS. The airport is used by commercial, military, and general aviation aircraft. In 1994, McCarran International Airport had 488,347 aircraft operations (take-offs and landing). Another airport located just north of McCarran International is the North Las Vegas Airport. The airport is used by commercial air taxi, military, and general aviation aircraft. In 1994, North Las Vegas Airport had 188,707 aircraft operations (PC 1996j). The closest air field, Indian Spring Auxiliary Field, has two runways, is located approximately 48 kilometers (30 miles) southeast of the DAF, and is used by military aircraft. Beatty Airfield, is located approximately 67 kilometers (42 miles) west of the DAF, has one runway, and is used by general aviation aircraft. There are five landing strips located on or near NTS. The most frequently used is the Desert Rock Airstrip located in Area 22 southwest of Mercury. Desert Rock Airstrip has a single runway and is 30 kilometers (19 miles) south of the DAF. Two unnamed, single runway airstrips are located on NTS; one located 6 kilometers (4 miles) north at Yucca Lake in Area 6, and the other 27 kilometers (17 miles) south in Area 22. Similarly, two unnamed, single runway airstrips are located west of NTS; one located 62 kilometers (39 miles) west-northwest and the other 78 kilometers (49 miles) north-northwest. A description of the x and y coordinate system, the category of aircraft operations that occurred, and a screening of the probability density function values for the four airports and five landing strips is contained in Table E.3.3-1. All nine of the airports are either outside the boundary for all categories of aircraft or the activity at the facility was sufficiently low so it was bounded by the in-flight activity and therefore were not included in aircraft crash analysis. Therefore, only Non-Airport (in-flight) aircraft were included in the analysis as required by the Final DOE Standard.
E.3.3.1 Aircraft Crash Affected Environment
An adjustment to the Near Airport and Non-Airport models consisted of manipulation of the flight modes (i), aircraft categories (j), and aircraft sources (k) to fit the NTS. The flight mode, i, was set equal to one flight mode.
i = 1 In-flight
The aircraft categories are very similar to Pantex except helicopters have been omitted because they are not shown to be penetrating missiles.
j = 1 Commercial: Air Carrier
j = 2 Commercial: Air Taxi
j = 3 Military: Large (Bombers and Cargoes)
j = 4 Military: Small (Attack, Fighters, and Trainers)
j = 5 General: Fixed-wing, reciprocating, single engine
j = 6 General: Fixed-wing, reciprocating, multi-engine
j = 7 General: Fixed-wing, turboprop
j = 8 General: Fixed-wing, turbojet
Here the aircraft source, k, was summed over one phase
k = 1 Non-Airport Aircraft
An estimate of an aircraft crash into the DAF was generated using the probability equation defined in Section E.2.1. Using this information, the probability equation becomes:

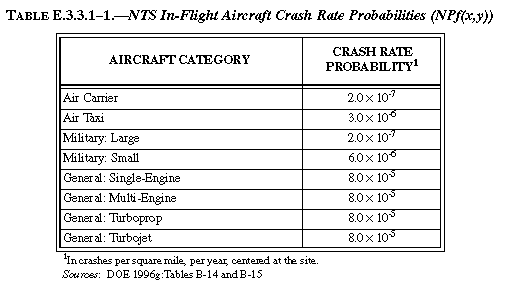
The model for the aircraft in-flight was changed from the Solomon Model in the DOE Draft Standard to a curve-fitted empirical model in the Final DOE Standard based on crashes that have occurred throughout the country. The Final DOE Standard supplies the value for NPf(x,y) for each DOE site. Only the area of the facility is calculated. The crash rate probability per square mile for Hanford are shown in Table E.3.3.1-1.
E.3.3.2 Area Calculation
The DAF was modeled conservatively as a single facility with a length of 201 meters (659 feet), a width of 76 meters (250 feet), and a height of 9 meters (30 feet). (Memo from Longmire at SNL ) Using the methodology developed above for the Pantex Plant for a rectangular facility:
At = (2 × L × W × WS) ÷ R + (L × W)
Ash = (WS + R) Hcotf
R = (L2 + W2)0.5
Ask = (WS + R) × S
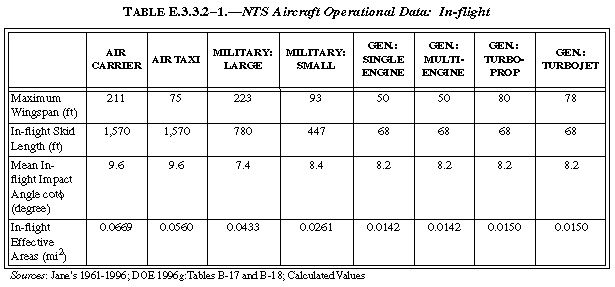
An impact angle, f , dependent on the aircraft category and the flight mode was used here as was done in the Pantex analysis. Also, the representative maximum wingspan dimensions, WS, for each aircraft category used are also the same. The total area for the structures includes the contribution from the skid area with the skid distances from the Final DOE Standard. For large military aircraft the take-off skid distance was used for in-flight aircraft since it was conservative. Table E.3.3.2-1 gives aircraft operational data for in-flight.
E.3.3.3 Impact Probability Calculation
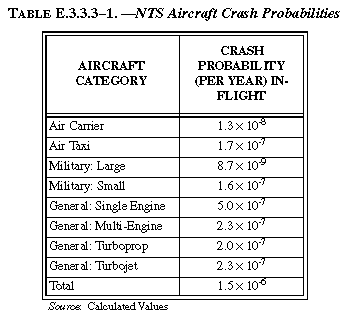
With substitution of the above data into the probability equation, the impact probabilities listed in Table E.3.3.3-1 are obtained. Since the frequency of hitting the DAF, 1.5 × 10⁻⁶, was greater than 10-7, the Final DOE Standard stated that further analysis was needed.
E.3.3.4 Structural Calculation
Given that an aircraft impacts into the DAF, there is only a risk to human health if the storage facility is penetrated and the storage containers are damaged sufficiently to release plutonium into the environment. Since the pit storage will be done within AT-400A certified Type B shipping containers, minor damage to the storage facility is not anticipated to cause container failure. However, significant damage to the storage facility is likely to damage containers sufficiently enough to cause a plutonium release.
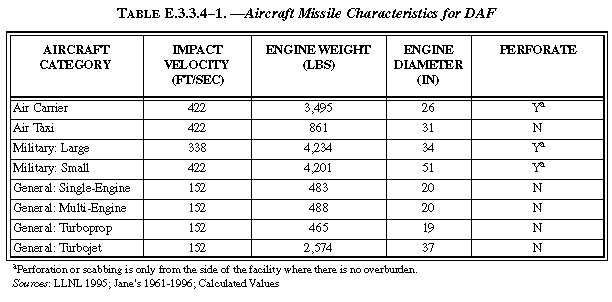
A structural analysis was done according to the Final DOE Standard for the facility with a wall thickness of 46 centimeters (18 inches) (DAF SAR). This wall thickness was selected since it is the minimum thickness for the bays and cells where plutonium would be stored. An overburden of 1.5 meters (5 feet) was included for three sides and the roof of the facility. On the fourth side of the facility only the wall was modeled. The analysis was done for the maximum penetrator missile for each of the eight categories of aircraft. The commercial air carrier, large military, and small military were the only three aircraft missiles to penetrate the facility from the side of the facility without an overburden. The aircraft modeled and whether they penetrate the facility are shown in Table E.3.3.4-1.
E.3.3.5 Release Probability Calculation
The impact probability calculation was repeated for the commercial carrier, large military, and small military to determine the release probability. Only the side of the facility without an overburden was included. With substitution of the above data into the probability equation, the release probabilities were 1.3 × 10⁻⁸, 3.7 × 10⁻⁹ and 6.3 × 10⁻⁸, respectively. Since the frequency of hitting the DAF, 8.1 × 10⁻⁸, was less than 10-7, the Final DOE Standard stated that no further analysis was needed.
E.3.3.6 Consequence Calculation
The probability of an aircraft hitting the DAF at NTS is 1.5 × 10⁻⁶. The probability of damaging the DAF due to perforation is 8.1 × 10⁻⁸. The P-Tunnel was not analyzed since pit stored there would be immune from aircraft accidents. Consistent with the Final DOE Standard, a consequence analysis has not been performed for this accident.
E.3.4 SAVANNAH RIVER SITE
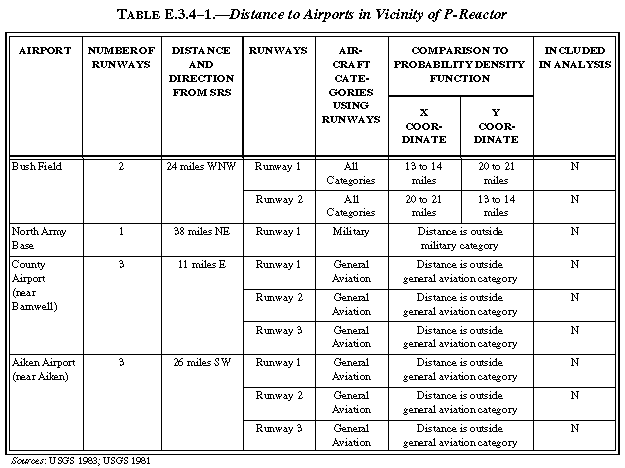
There are four airports in the vicinity of the P-Reactor. Bush Field, the major commercial airfield in the area, has two runways and is located approximately 38 kilometers (24 miles) west-northwest of the P-Reactor. The airport is used by commercial, military, and general aviation aircraft. In 1994, Bush Field had 39,461 aircraft operations (take-offs and landing) (PC 1996j). The closest airport, the county airport near Barnwell, has three runways, is located approximately 18 kilometers (11 miles) east of P-Reactor, and is used by general aviation aircraft. Similarly, Aiken Airport, near Aiken, is located approximately 46 kilometers (29 miles) north-northwest, has three runways, and is also used by general aviation aircraft. The North Army Base is located approximately 61 kilometers (38 miles) northeast, has one runway, and is used by military aircraft. A description of the x and y coordinate system, the category of aircraft operations that occurred, and a screening of the probability density function values for the four airports is contained in Table E.3.4-1. All four of the airports are outside the boundary for all categories of aircraft and therefore were not included in the aircraft crash analysis. Therefore, only Non-Airport (in-flight) aircraft were included in the analysis as required by the Final DOE Standard.
E.3.4.1 Aircraft Crash Affected Environment
An adjustment to the Near Airport and nonairport models consisted of manipulation of the flight modes (i), aircraft categories (j), and aircraft sources (k) to fit the SRS. The flight modes, i, was set equal to one flight mode.
i = 1 In-flight
The aircraft categories are very similar to Pantex except helicopters have been omitted because they are not shown to be penetrating missiles.
j = 1 Commercial: Air Carrier
j = 2 Commercial: Air Taxi
j = 3 Military: Large (Bombers and Cargoes)
j = 4 Military: Small (Attack, Fighters, and Trainers)
j = 5 General: Fixed-wing, reciprocating, single engine
j = 6 General: Fixed-wing, reciprocating, multi-engine
j = 7 General: Fixed-wing, turboprop
j = 8 General: Fixed-wing, turbojet
Here the aircraft source, k, was summed over one phase
k = 1 Non-Airport Aircraft
An estimate of an aircraft crash into the P-Reactor was generated using the probability equation defined in Section E.2.1. Using this information, the probability equation becomes:
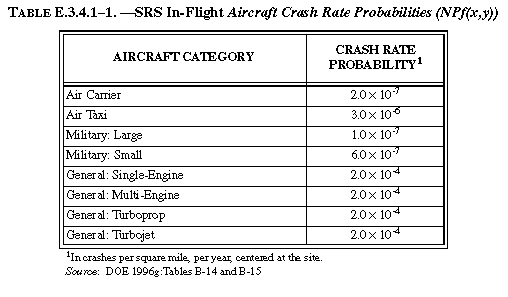
The model for the aircraft in-flight was changed from the Solomon Model in the DOE Draft Standard to a curve-fitted empirical model in the Final DOE Standard based on crashes that have occurred throughout the country. The Final DOE Standard supplies the value for NPf(x,y) for each DOE site. Only the area of the facility is calculated. The crash rate probability per square mile for SRS are shown in Table E.3.4.1-1.
E.3.4.2 Area Calculation
The P-Reactor was modeled conservatively as a facility with a length of 69 meters (225 feet), a width of 57 meters (187 feet), and a height of 9 meters (30 feet). (Fax from Matthews at SRS ) Using the methodology developed above for the Pantex Plant for a rectangular facility:
At = (2 × L × W × WS) ÷ R + (L × W)
Ash = (WS+R) × H cotf
R = (L2 + W2)0.5
Ask = (WS + R) × S
An impact angle, f , dependent on the aircraft category and the flight mode was used here as was done in the Pantex analysis. Also, the representative maximum wingspan dimensions, WS, for each aircraft category used are also the same. The total area for the structures includes the contribution from the skid area with the skid distances from the Final DOE Standard. For large military aircraft the take-off skid distance was used for in-flight aircraft since it was conservative. Table E.3.4.2-1 gives aircraft operational data for in-flight.
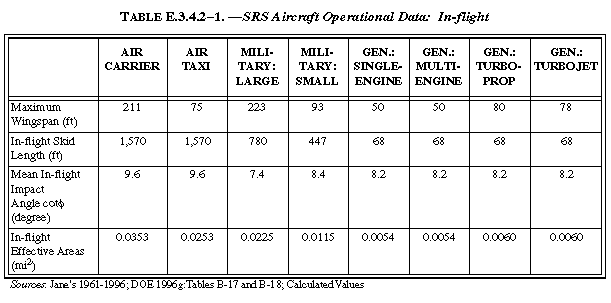
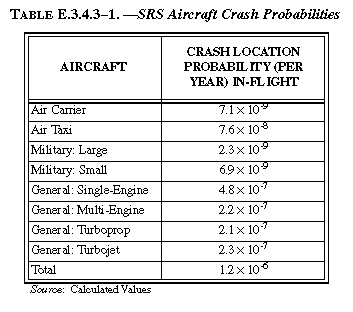
E.3.4.3 Impact Probability Calculation
With substitution of the above data into the probability equation, the impact probabilities listed in Table E.3.4.3-1 are obtained. Since the frequency of hitting the P-Reactor, 1.2 × 10⁻⁶, was greater than 10-7, the Final DOE Standard stated that further analysis was needed.
E.3.4.4 Structural Calculation
Given that an aircraft impacts into the P-Reactor, there is only a risk to human health if the storage facility is penetrated and the storage containers are damaged sufficiently to release plutonium into the environment. Since the pit storage will be done within AT-400A certified Type B shipping containers, minor damage to the storage facility is not anticipated to cause container failure. However, significant damage to the storage facility is likely to damage containers sufficiently enough to cause a plutonium release.
A structural analysis was done according to the Final DOE Standard for the facility with a wall thickness of 76 centimeters (30 inches). The analysis was done for the maximum penetrator missile for each of the eight categories of aircraft. The commercial air carrier and large military were the only two aircraft missiles to penetrate the facility. The aircraft modeled and whether they penetrate the facility are shown in Table E.3.3.4-1.
E.3.4.5 Release Probability Calculation
The impact probability calculation was repeated for the commercial carrier and large military to determine the release probability. With substitution of the above data into the probability equation, the release probabilities were 7.1 × 10⁻⁹ and 2.2 × 10⁻⁹, respectively. Since the frequency of hitting the P-Reactor, 9.2 10-9, was less than 10-7, the Final DOE Standard stated that no further analysis was needed.
E.3.4.6 Consequence Calculation
The probability of an aircraft hitting the P-Reactor at SRS is 1.2 × 10⁻⁶. The probability of damaging the P-Reactor by perforation is 9.2 × 10⁻⁹. Consistent with the Final DOE Standard, a consequence analysis has not been performed for this accident.
E.3.5 HANFORD SITE
The Federal Aviation Administration maintains a Very High Frequency Omni-Directional Radio Range navigation aid at the Tri-Cities Airport. Several Federal airways pass in the proximity of the FMEF. However, the Federal Aviation Administration reports that these routes of low usage (WHC 1991). There are no military installations or training routes that would place military aircraft in the vicinity of FMEF.
There are five airports and one landing strip in the vicinity of the FMEF. The Tri-Cities Airport, the major commercial airfield in the area, has two runways and is located approximately 27 kilometers (17 miles) southeast of the FMEF. The airport is used by commercial, military, and general aviation aircraft. In 1994, the Tri-Cites Airport had 81,867 aircraft operations (take-offs and landings) (PC 1996j). The closest airport, the Richland Airport, has three runways, is located approximately 13 kilometers (8 miles) southeast of FMEF, and is used by general aviation aircraft. Similarly, Vista Field in Kennewick, is located approximately 26 kilometers (16 miles) south-southeast, has two runways, and is also used by general aviation aircraft. The same is true of Beardsley Field, near Prosser, located 42 kilometers (26 miles) southwest, with one runway, and used by general aviation aircraft. Sunnyside Airport is located 48 kilometers (30 miles) west-southwest, has one runway, and is also used by general aviation aircraft. There is one unnamed landing strip near Horse Heaven Hills, approximately 32 kilometers (20 miles) south-southwest, has one runway, and is used by general aviation aircraft. A description of the x and y coordinate system, the category of aircraft operations that occurred, and a screening of the probability density function values for the six airports and one landing strip is contained in Table E.3.5-1. All five of the general aviation airports and the landing strip are outside the probability density boundary for general aviation aircraft and, therefore, were not included in the aircraft crash analysis. For the Tri-Cities Airport only small military in the landing mode had a nonzero probability density function value. Therefore, only small military in the landing mode at the Tri-Cities Airport, and Non-Airport (in-flight) aircraft were included in the analysis as required by the Final DOE Standard.
E.3.5.1 Aircraft Crash Affected Environment
An adjustment to the Near Airport and nonairport models consisted of manipulation of the flight modes (i), aircraft categories (j), and aircraft sources (k) to fit the Hanford Site. The flight mode, i, was set equal to two flight modes.
i = 1 In-flight
i = 2 Landing
The aircraft categories are very similar to Pantex except helicopters have been omitted because they are not shown to be penetrating missiles.
j = 1 Commercial: Air Carrier
j = 2 Commercial: Air Taxi
j = 3 Military: Large (Bombers and Cargoes)
j = 4 Military: Small (Attack, Fighters, and Trainers)
j = 5 General: Fixed-wing, reciprocating, single engine
j = 6 General: Fixed-wing, reciprocating, multi-engine
j = 7 General: Fixed-wing, turboprop
j = 8 General: Fixed-wing, turbojet
Here the aircraft source, k, was summed over two phases
k = 1 Tri-Cities Airport Runway 1
k = 2 Non-Airport Aircraft
An estimate of an aircraft crash into the FMEF was generated using the probability equation defined in Section E.2.1. Runway 1 is the preferred runway for take-offs and landings at the Tri-Cities and so all operations were assumed to occur on that runway. Table E.3.5.1-1 summarizes the 1994 Tri-Cities airport traffic activity (PC 1996j). It was conservatively assumed for this analysis that all of the flights passed in proximity to FMEF. Since the number of operations was for only air carrier, air taxi, military, and general aircraft, the number of military and general operations was divided by the same ratio that was determined for Pantex. While this assumption may not necessarily be valid it did not affect the final results for this analysis.
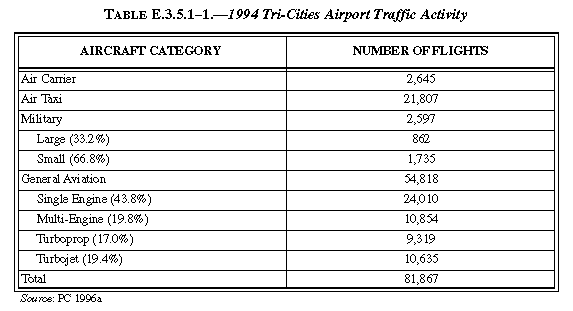
The crash rates values described in Section E.2.1 were used here in this analysis. The distance to the runway and number of annual flight operations were modeled conservatively in this aircraft impact probability assessment.
Using this information, the probability equation becomes:
Data in Table E.3.5.1-1 does not differentiate between take-offs and landings. Hence, it was assumed that half of the tabulated operations are take-offs, and half are landings. Crash rates are given in Table E.3.5.1-2.
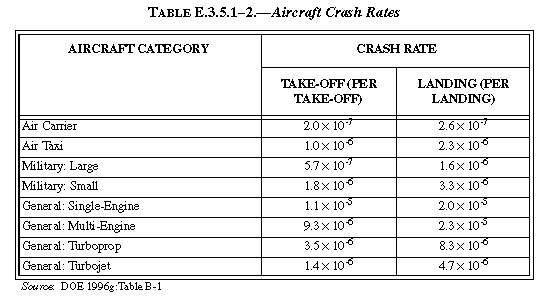
The aircraft crash location probability for each aircraft category and flight mode appears in Table E.3.5.1-3 (DOE 1996: B-12 to B-23). Using the coordinate convention in the Near Airport model, the center-line and perpendicular distances to Point 4, the hypothetical storage facility, are:
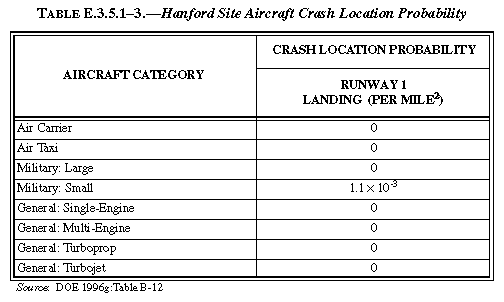
Runway 1 16.5 miles, 0.5 miles
Both the air carrier and air taxi crash, and the four general
aviation categories location probabilities in Table E.3.5.1-3
are identical because their crash location probabilities are grouped
into a single category.
The crash location probabilities for general aviation are asymmetrical in the Final DOE Standard. Therefore, in preparing Table E.3.5.1-3 the more conservative crash probabilities were used. This conservative convention was also applied to military crash location probabilities.
The model for the aircraft in-flight was changed from the Solomon Model in the DOE Draft Standard to a curve-fitted empirical model in the Final DOE Standard based on crashes that have occurred throughout the country. The Final DOE Standard supplies the value for NPf(x,y) for each DOE site. Only the area of the facility is calculated. The crash rate probability per square mile for Hanford are shown in Table 3.5.1-4.
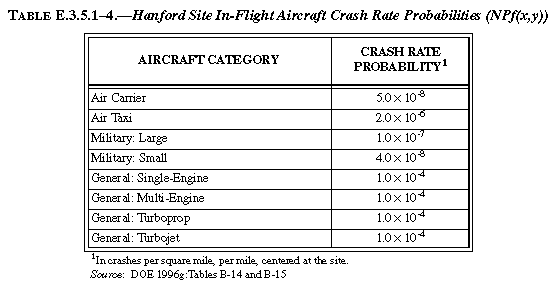
E.3.5.2 Area Calculation
The FMEF was modeled conservatively as a facility with a length of 98 meters (320 feet), a width of 47 meters (155 feet), and a height of 21 meters (70 feet). (FMEF Feasibility Assessment for WCRP). Using the methodology developed above for the Pantex Plant for a rectangular facility:
At = (2 × L × W × WS) ÷ R + (L × W)
Ash = (WS+R) × H cotf
R = (L2 + W2)0.5
Ask = (WS + R) × S
An impact angle, f , dependent on the aircraft category and the flight mode was used here as was done in the Pantex analysis. Also, the representative maximum wingspan dimensions, WS, for each aircraft category used are also the same. The total area for the structures includes the contribution from the skid area with the skid distances from the Final DOE Standard. For large military aircraft the take-off skid distance was used for in-flight aircraft since it was conservative. Table E.3.5.2-1 gives aircraft operational data for in-flight and landings.
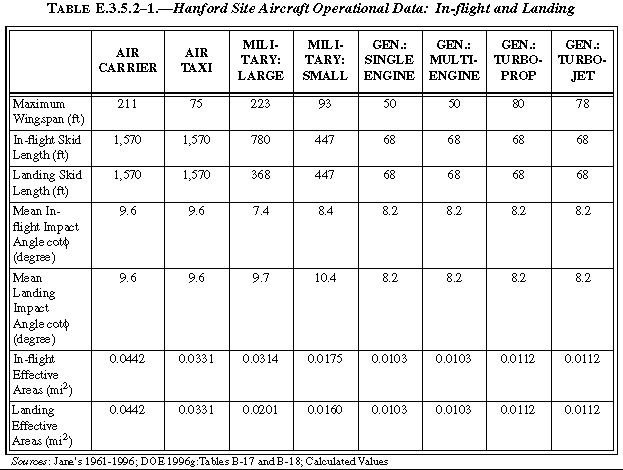
E.3.5.3 Impact Probability Calculation
With substitution of the above data into the probability equation, the impact probabilities listed in Table E.3.5.3-1 are obtained. Since the frequency of hitting the FMEF, 1.2 × 10⁻⁶, was greater than 10-7, the Final DOE Standard stated that further analysis was needed.
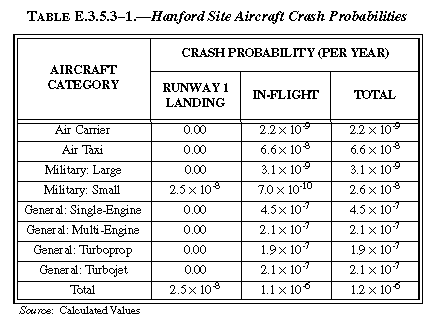
E.3.5.4 Structural Calculation
Given that an aircraft impacts into the FMEF, there is only a risk to human health if the storage facility is penetrated and the storage containers are damaged sufficiently to release plutonium into the environment. Since the pit storage will be done within AT-400A certified Type B shipping containers, minor damage to the storage facility is not anticipated to cause container failure. However, significant damage to the storage facility is likely to damage containers sufficiently enough to cause a plutonium release.
A structural analysis was done according to the Final DOE Standard for the facility with a wall thickness of (wall thickness of 122 centimeters (48 inches). The analysis was done for the maximum penetrator missile for each of the eight categories of aircraft. None of the eight aircraft missiles penetrated the facility and therefore the frequency of releasing material from the FMEF was 0. Since the frequency of releasing material is less than 10-7, the Final DOE Standard stated no further analysis was needed. The aircraft modeled and whether they penetrate the facility are shown in Table E.3.5.4-1.
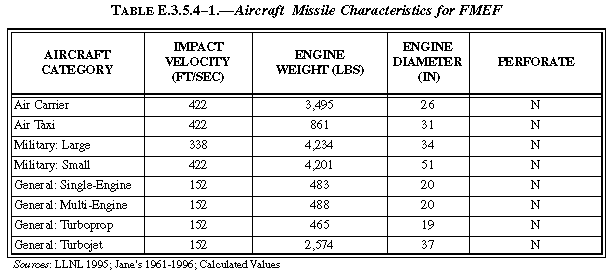
E.3.5.5 Consequence Calculation
The probability of an aircraft hitting the FMEF at Hanford is 1.2 × 10⁻⁶. The probability of damaging the FMEF by perforation is 0.0. Consistent with the Final DOE Standard, a consequence analysis has not been performed for this accident.
References
Map 1 U.S. Geological Survey, Albuquerque Quadrangle, N3500-W10600/30x60, U.S. Department of the Interior, Denver, CO, 1978.
Map 2 U.S. Geological Survey, Belen, New Mexico, N3430-W10600/30x60, U.S. Department of the Interior, Denver, CO, 1979.
Map 3 U.S. Geological Survey, Pahranaget Range, Nevada, 37115-A1-TM-100, U.S. Department of the Interior, Denver, CO, 1985.
Map 4 U.S. Geological Survey, Beatty, Nevada-California, 36116-E1-TM-100, U.S. Department of the Interior, Denver, CO, 1986.
Map 5 U.S. Geological Survey, Indian Springs, Nevada, 36115-E1-TM-100, U.S. Department of the Interior, Denver, CO, 1988.
Map 6 U.S. Geological Survey, Pahute Mesa, Nevada, N3700-W11600/30x60, U.S. Department of the Interior, Denver, CO, 1979.
Map 7 U.S. Geological Survey, Barnwell, South Carolina-Georgia, 33081-A1-TM-100, U.S. Department of the Interior, Denver, CO, 1983.
Map 8 U.S. Geological Survey, Aiken, South Carolina-Georgia, 33081-E1-TM-100x60, U.S. Department of the Interior, Denver, CO, 1981.
Map 9 U.S. Geological Survey, Richland Quadrangle, N4600-W11900/30x60,
U.S. Department of the Interior, Denver, CO, 1978.
FAX Trembly FAA Data
DOE 1996 Final Standard
Memo from Longmire at SNL Davin Supplied
DAF SAR
Fax from Matthew at SRS
FMEF Feasibility Assessment of WCRP Davin Supplied
DOE 1990 From Appendix E of Draft EIS
DOE 1994w From page 7-12 of Draft EIS
PC 1995b From page 7-23 of Draft EIS
Figure E.3.1.3Ð1.ÑPantex Plant and the Amarillo International Airport.
|
NEWSLETTER
|
| Join the GlobalSecurity.org mailing list |
|
|
|