


APPENDIX C WATER RESOURCES ANALYSIS
This appendix supplements the information on the characterization of surface water, groundwater, and water quality presented in section 4.6, Water Resources.
C.1 SURFACE WATER
Surface water studies and data were reviewed during a literature search performed for this EIS. Surface water availability and use were not primary issues of concern, because groundwater is the source of all water supplied to Pantex Plant.
C.1.1 Hydrologic Characterization
Playas are the primary surface water feature at Pantex Plant and the surrounding vicinity. The assessment and characterization of playas was important for determining the potential for flooding onsite, the significance of playas as a source of recharge to groundwater, and evaluation of playas as receptors of wastewater disposal. Numerous investigations have attempted to characterize the significance of playas at and in the vicinity of Pantex Plant. The characterization of surface water resources in the EIS took these and other investigations into account.
C.1.2 Surface Water Quality
Evaluation of baseline surface water quality is based on a review of data tabulated in Pantex Plant annual environmental reports for a 5-year period, from 1990 through 1994. Information regarding surface water monitoring stations and sources of flow are summarized in volume I, Table 4.6.1.1-2. Surface water quality samples were collected and analyzed for a full suite of analytical laboratory parameters, including radionuclides, metals, high explosive(s) (HE), polychlorinated biphenyls (PCBs), pesticides, herbicides, volatile organics, semivolatile organics and other miscellaneous constituents and field parameters. Samples were collected from 29 onsite sampling locations from 1990 to 1993; surface water samples were collected from only 17 of these sampling locations in 1994. The surface water quality data collected over the past 5 years do not include every sampling location each year, because some locations only have sufficient water to sample during storm events. One offsite location, Bushland Playa at the U.S. Department of Agriculture's Agricultural Experimental Station 54 kilometers (34 miles) west of Pantex Plant, was used as a control sample to give some insight on background surface water quality. Suspected contaminants of concern (COCs) were determined by comparing tabulated annual average values to the following defined surface water quality decision criteria:
- Texas State Water Quality Criteria, Aquatic Life Protection (§307.2-307.10) for fresh water acute aquatic life protection (TWC 1991).
- Texas State Water Quality Criteria, Human Health Protection (§307.2-307.10) for water and fish (TWC 1991).
- Environmental Protection Agency (EPA) Region 6 National Pollutant Discharge Elimination System (NPDES) Permit (No. TX-0107107) (EPA 1996).
- TNRCC permit to dispose of wastes (Permit No. 02296) (TNRCC 1996).
- DOE Derived Concentration Guides (DOE Order 5400.5) for radionuclide health standards.
The summary of surface water quality decision criteria defined for Pantex Plant is presented in Table C.1.2-1 (all tables are presented at the end of this appendix). The Texas State Water Quality Criteria do not apply directly to the Pantex Plant playas; these decision criteria were selected for comparative purposes only. The State of Texas applies regulations through the concentration limits specified in permits; therefore, decision criteria for surface water compliance are based on permit limits established in the EPA NPDES Permit and TNRCC Wastewater Discharge Permit for Pantex Plant. Pantex Plant has worked very closely with EPA Region VI and TNRCC to produce wastewater discharge permits (EPA NPDES Permit No. TX-0107107 and TNRCC Wastewater Discharge Permit No. 02296) that dictate stringent wastewater discharge requirements protective of human health and the environment. Permit limits specified in the Pantex Plant NPDES Permit for various outfalls are provided in Table C.1.2-2.
Pantex Plant wastewater discharge permit limits meet or exceed all current regulations that apply to surface water. DOE Derived Concentration Guides (DOE Order 5400.5) are used as decision criteria for radionuclides. The Atomic Energy Act of 1954 (42 U.S.C. 2011), as amended, authorizes DOE to protect public health and safety and the environment in conducting programs, such as Pantex Plant operations. As a result, DOE is self-regulating with respect to standards and requirements for radiation.
The following assumptions were made for this analysis:
- Some of the Texas State Water Quality Criteria standards (e.g., copper, nickel, zinc, cadmium, and lead) are defined as a function of hardness. The average water hardness at Pantex Plant was assumed to be 128 milligrams per liter. Therefore, the following criteria were determined:
- - Copper = 0.024 milligrams per liter.
- - Nickel = 1.75 milligrams per liter.
- - Zinc = 0.144 milligrams per liter.
- - Cadmium = 0.045 milligrams per liter.
- - Lead = 0.112 milligrams per liter.
- Tabulated water quality data are assumed to be representative of the sampling locations. State-approved standard operating procedures have been used in sample collection and analysis, and the results are assumed to be validated using EPA-approved methodology.
The emphasis of the surface water quality analysis results is placed on Playa 1, since it is the only onsite perennial wetland and receives discharge from the Wastewater Treatment Facility. The suspected COCs in samples from Playa 1 are presented in Table C.1.2-3. With the exception of Playa 1, all Pantex Plant surface water sampling locations are usually dry except during storm events. Because of frequent dry periods, soil sampling is likely to be more representative of the extent of contamination, if any, at these sampling locations. Soil sampling is discussed in section 4.5 and appendix I. Surface water quality results for sampling locations other than Playa 1 are presented in Table C.1.2-4.
C.2 GROUNDWATER
Evaluation of Pantex Plant groundwater resources involved three primary components:
- Hydrogeologic site characterization of the perched and Ogallala aquifers.
- Evaluation of groundwater quality data.
- Determination of groundwater availability and use.
C.2.1 Hydrogeologic Properties
Hydrogeologic parameters (e.g., hydraulic conductivity, transmissivity, recharge, groundwater velocity) at Pantex Plant have been estimated during investigations by Battelle Pantex, the University Consortium (including Texas Tech University and Texas A&M University), the U.S. Army Corps of Engineers (COE), Argonne National Laboratories, Engineering-Science, Inc., and Radian Corporation.
Existing available well information for the Pantex Plant Site area has been identified, compiled, and tabulated (Table C.2.1-1). This table was compiled based on data provided by Pantex Plant, Texas A&M University, and COE. Wells reported with an unknown status are those for which data were unavailable. Well locations are shown in volume I, Figure 4.6.1.2-2. Well construction information and hydraulic parameter data were compiled and tabulated to determine which wells would provide enough information to assess the groundwater hydraulic parameters (Table C.2.1-2).
Available Pantex Plant area well logs and specific capacity estimates from wells within an 8-kilometer (5-mile) radius from Pantex Plant Site were obtained from COE except where noted. Vertical saturated hydraulic conductivities were determined for the Texas Department of Criminal Justice Playa, located approximately 11 kilometers (7 miles) northeast of Pantex Plant. The results of this playa investigation are summarized in Table C.2.1-3.
The following assumptions were made in the evaluation of the existing hydrogeologic data:
- The Theis curve method was assumed to be the most representative method to evaluate the drawdown data used to calculate transmissivities from perched monitoring wells OW-WR-19, -20, -38, -44, and -45.
- For wells BEG-PTX2, BEG-PTX3, PTX08-1008, and PTX06-1004, the ambient vertical hydraulic conductivity (KV) value was reported.
- When actual Quality Assurance/Quality Control forms, data validation forms, or chain of custody information was unavailable it was assumed that the data presented in each report were valid and that approved methodologies for sample collecting and testing were implemented.
C.2.2 Groundwater Quality
Baseline groundwater quality was assessed using data tabulated in Pantex Plant annual environmental reports for a 5-year period, from 1990 through 1994. Additional perched groundwater quality data, collected in conjunction with the Resource Conservation and Recovery Act (RCRA) site investigations, were also examined. Groundwater quality monitoring data were collected from wells completed in the perched and Ogallala aquifers. Groundwater quality data used for the analysis were collected from reported onsite sampling locations from January 1990 to December 1994. The drinking water from an Ogallala water supply well at Bushland, located 54 kilometers (34 miles) west of Pantex Plant was also sampled to provide regional background groundwater quality data. The control well at Bushland is completed in the Ogallala aquifer upgradient from Pantex Plant and is, therefore, unaffected by plant operations (Pantex 1996a:82).
Groundwater samples collected from perched and Ogallala wells were analyzed for a full suite of analytical laboratory parameters, including radionuclides, metals, HEs, PCBs, pesticides, herbicides, volatile organics, semivolatile organics and other miscellaneous constituents and field parameters. It should be noted that the groundwater data collected over the 5 years does not include every sampling location or parameter each year. The following decision criteria for groundwater quality were used in the evaluation:
- TNRCC Primary and Secondary Drinking Water Standards Governing Drinking Water Quality and Reporting Requirements (§290.101-290.119).
- EPA, Drinking Water Regulations and Health Advisories, Maximum Contaminant Levels, and Secondary Maximum Contaminant Levels.
- DOE Derived Concentration Guides (DOE Order 5400.5) for radionuclide health standards.
In addition, groundwater quality data were compared to Pantex Plant Risk Reduction Standards (RRSs), or proposed groundwater cleanup levels for anticipated potential contaminants at Pantex Plant. These derived RRS values were established for the RCRA Facility Investigations (RFIs) (DOE 1994). The summary of groundwater quality decision criteria and RRS values is presented in Table C.2.2-1.
The following assumptions were made in the groundwater quality evaluation for the EIS:
- Gross alpha (dissolved) (GAd) and gross beta (dissolved) (GBd) values reported in the annual environmental reports were the actual measured values.
- Tabulated water quality data are assumed to be representative of the sampling locations. Agency-approved standard operating procedures have been used in sample collection and analysis, and the results are assumed to be validated using EPA-approved methodology.
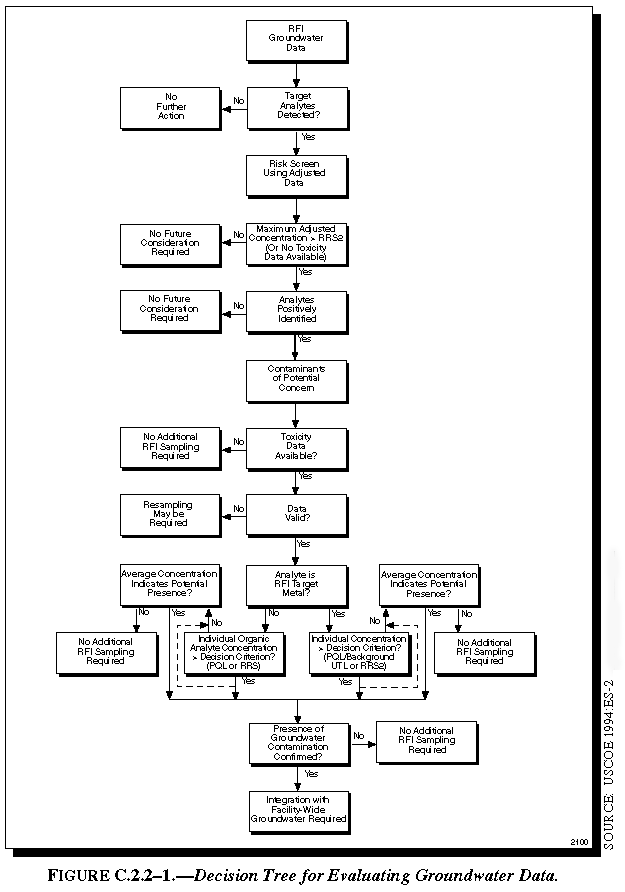
In addition to the routine sampling documented in the annual environmental reports, available COE quarterly groundwater monitoring reports were reviewed. Quarterly groundwater monitoring was conducted to characterize the groundwater quality and extent of contamination in the perched aquifer, in association with the Ditches and Playas RFI for Flow System 6, groundwater in the perched aquifer. Flow System No. 6 includes groundwater data from perched monitoring wells constructed in Solid Waste Management Unit (SWMU) 5 Areas 10, 11, 12, and SWMU 6. Groundwater samples were collected from perched aquifer monitoring wells to determine the nature and presence or probable absence of contamination. Figure C.2.2-1 outlines the decision tree used to evaluate the groundwater data.
Figure C.2.2-1. Decision Tree for Evaluating Groundwater Data.
All groundwater samples were analyzed for total metals, cyanide, volatile organics, semivolatile organics, HEs, radionuclides, pesticides, and PCBs. Analytical data collected during the RFI were screened using a risk-based approach. This approach is based on the toxicological properties and the maximum reported concentrations of detected RFI target analytes. Throughout this screening process, the constituents that pose no significant risk to human health and the environment were eliminated from further consideration. After this process was complete, a list of suspected constituents of potential concern was compiled.
In general, analytical data were evaluated against decision criteria, including Texas RRS 1 (background upper tolerance limits and practical quantitation limits) and RRS 2 (risk based action levels), to determine the nature and extent of contamination and to assess the need for additional sampling (USCOE 1994:ES-1, ES-2, 1-1, 1-3). It should be noted that the water quality constituents that were analyzed for the COE investigation are not always the same constituents that were analyzed for the annual environmental reports. The results of both the annual environmental reports and COE investigations are presented in Table C.2.2-2 for the perched aquifer and Table C.2.2-3 for the Ogallala aquifer. Site characterization investigations are ongoing.
Table C.1.2-1 Defined Surface Water Quality Decision Criteria for Pantex Plant Surface Water (.pdf)
Table C.1.2-2 Pantex Plant NPDES Permit No. TX0107107 Requirements (.pdf)
Table C.2.1-1 Pantex Plant Well Information (.pdf)
Table C.2.1-2 Hydraulic Parameter Summary of Onsite Wells (.pdf)
Table C.2.1-3 Vertical Saturated Hydraulic Conductivity (.pdf)
REFERENCES
References for Appendix C. (.pdf)
|
NEWSLETTER
|
| Join the GlobalSecurity.org mailing list |
|
|
|