


4.2 Alternative A - Limited Treatment Configuration
This section describes the effects alternative A (described
in Section 2.4) would have on the existing environment (described in Chapter 3).
4.2.1 INTRODUCTION
Alternative A (limited treatment practices for waste at SRS)
includes the continuation of ongoing activities listed under the no-action
alternative (Section 4.1.1). In addition DOE would:
- Construct and operate a containment building to process mixed wastes.
- Operate a mobile soil sort facility.
- Treat small quantities of mixed and polychlorinated
biphenyl (PCB) wastes offsite.
- Burn mixed and hazardous wastes in the Consolidated Incineration Facility.
- Construct and operate a transuranic waste characterization/certification facility.
- Store transuranic wastes until they can be sent to the Waste Isolation Pilot Plant.
Storage facilities would be constructed on previously
cleared land in E-Area. The new waste treatment facilities for
characterization/certification of transuranic and alpha wastes
and for decontamination/macroencapsulation
(containment) of mixed waste would be built on undeveloped
land northwest of F-Area.
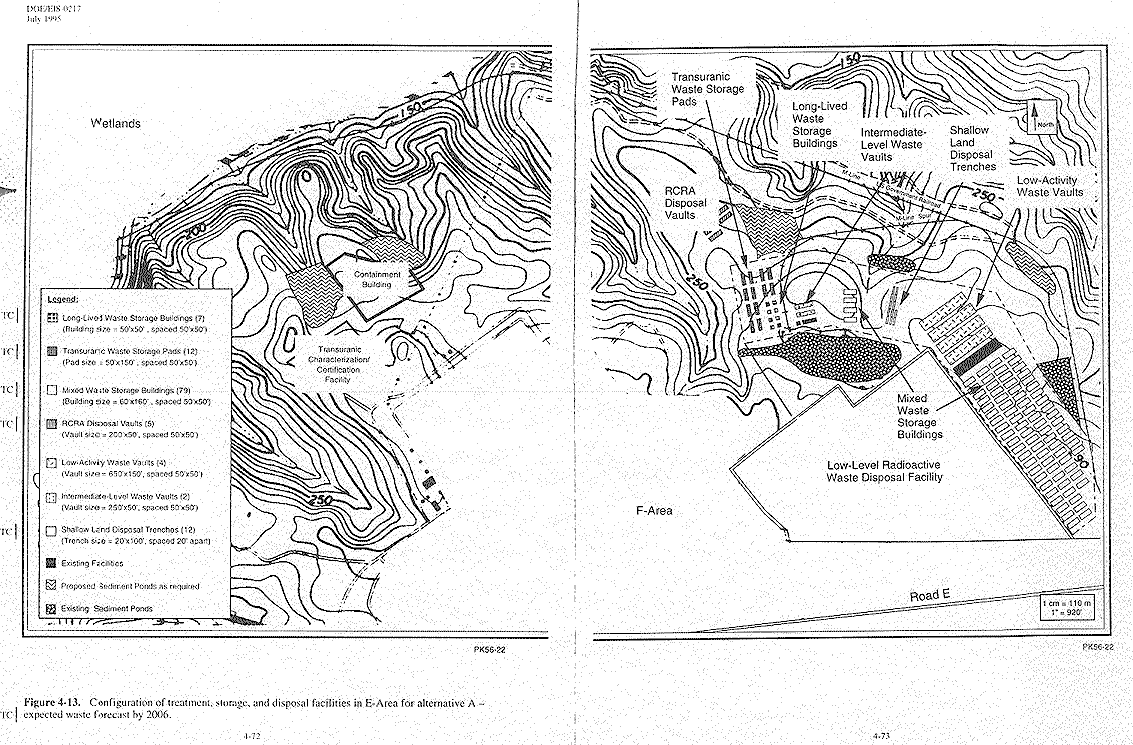
Construction related to this alternative would require 0.22 square kilometer (55 acres) of undeveloped land northwest of F-Area and 0.04 square kilometer (9 acres) of undeveloped land northeast of F-Area
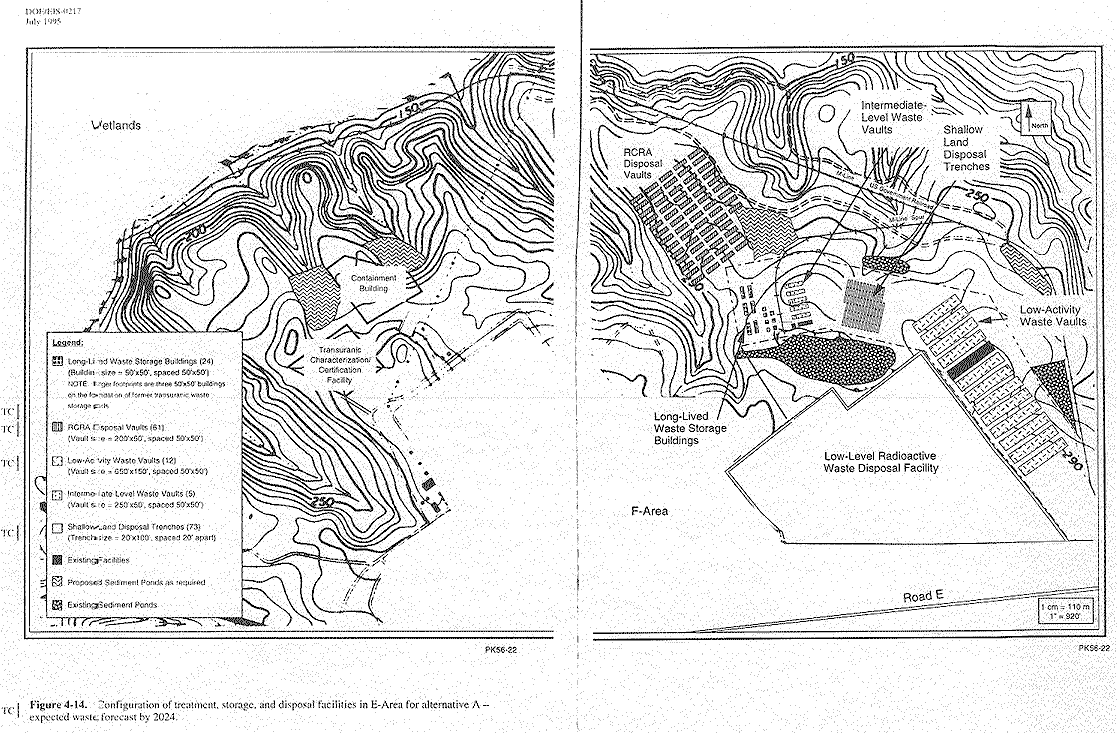
by 2006 (Figure 4-13). An additional 0.13 square kilometer (32 acres) of undeveloped land would be required by 2024 for construction of disposal vaults northeast of FArea (Figure 4-14). Other construction would be on previously cleared and developed land in the eastern portion of E-Area. The minimum waste forecast for this alternative would require 0.29 square kilometer (73 acres) of undeveloped land, and the maximum waste forecast would require 4.0 square kilometers (986 acres). Additional site-selection studies would be required to locate suitable land if the maximum waste forecast is realized.
4.2.2 GEOLOGIC RESOURCES

4.2.2.1 Geologic Resources - Expected Waste Forecast
Effects on geologic resources from alternative A -
expected waste forecast would result primarily from the construction of
new facilities. The effects discussed under the no-action alternative (Section
4.1.2) form the basis for comparison and are referenced in this section.
Although the number of facilities required for this case
would be substantially fewer than for the noaction alternative because
more waste would be treated and less would be stored, waste management
activities associated with alternative A expected waste forecast would
affect soils in EArea. The fewer number of facilities
and the corresponding decrease in the amount of land needed would result in
smaller effects on soils under this alternative. Cleared and graded land
required for this alternative totals approximately 0.26 square kilometer
(65 acres) (by 2006). Approximately 0.26 square kilometer (65 acres) of
undeveloped land in EArea would be cleared and graded for the construction
of new facilities through 2006. Later, an additional 0.13 square kilometer (32 acres)
would be cleared for construction of additional RCRApermitted disposal
vaults. This total of 0.39 square kilometer (96 acres) is
approximately 60 percent of the 0.65 square kilometer (160 acres)
of undisturbed land that would be required for the noaction alternative.
The potential for accidental oil, fuel, and chemical spills
would be lower under this alternative than under the noaction alternative
because of reduced construction and operation activities. Spill prevention,
control, and countermeasures for this scenario would be the same as for the noaction
alternative discussed in Section 4.1.2, and impacts to soils
would be very small.

4.2.2.2 Geologic Resources - Minimum Waste Forecast
Effects from alternative A - minimum waste forecast
would be slightly less than those for the expected waste forecast because less
land would be disturbed during construction activities. Approximately 0.17
square kilometer (41 acres) of cleared land (by 2008) and 0.29 square
kilometer (73 acres) of uncleared land (by 2024) would be used for
construction of treatment, storage, and disposal facilities.
For operations activities, spill prevention, control, and
countermeasures plans for this case would be the same as for the no-action
alternative.

4.2.2.3 Geologic Resources - Maximum Waste Forecast
Effects from alternative A - maximum waste forecast would be
greater than from the minimum or expected forecasts previously discussed,
because more land would be disturbed during construction activities.
Approximately 0.283 square kilometer (70 acres) of cleared land, 0.745 square
kilometer (184 acres) of uncleared land in E-Area, and 3.25 square
kilometers (802 acres) of land outside EArea, approximately 7 times as
much land as would be required for the expected waste forecast, would be used
for construction of treatment, storage, and disposal facilities.
For operations activities, spill prevention, control, and
countermeasures plans for this alternative would be the same as for the
no-action alternative; the potential for spills would be greater because there
would be more facilities, and larger amounts of wastes would be managed.
4.2.3 GROUNDWATER RESOURCES

4.2.3.1 Groundwater Resources - Expected Waste Forecast
This section discusses the effects of alternative A -
expected waste forecast on groundwater resources at
SRS. Effects can be evaluated by comparing the concentrations of contaminants
predicted to enter the groundwater for each alternative and waste forecast.
Effects on groundwater resources under the no-action alternative (Section 4.1.3)
form the basis for comparison among the alternatives and are referenced in this
section.
Operation and impacts of the M-Area Air Stripper and the F-
and H-Area tank farms would be the same as under the no-action alternative.
For the expected forecast and as noted in Section 4.1.3,
releases to groundwater from RCRApermitted disposal vaults would be
improbable during active maintenance; however, releases could eventually occur
after loss of institutional control and degradation of the vaults. Impacts from
the RCRApermitted disposal vaults would be similar to the effects under
the no-action alternative (Section 4.1.3).
There would be two more additional low-activity and
intermediate-level radioactive waste disposal vaults (17) than under the
no-action alternative (15). Modeling has shown that releases from these vaults
would not cause groundwater standards to be
exceeded during the 30-year planning period or the 100year institutional
control period. As in the no-action alternative, no radionuclide exceeded the 4 millirem
per year standard for a user of shallow groundwater from the hypothetical well
100 meters (328 feet) from the waste disposal facility at any time after
disposal (Toblin 1995). Also as in the noaction alternative,
the predicted concentrations of tritium would be a very
small fraction of the drinking water standard. The discussion in Section 4.1.3
on the basis for the 4 millirem standard also applies to this case.
Impacts under this forecast would be similar to the effects under the noaction
alternative.
Under this waste forecast, 73 additional slit trenches would be constructed. Twenty-seven (27) of these slit trenches would be used for disposal of suspect soil and have been evaluated using results from the previous Radiological Performance Assessment (Martin Marietta, EG&G, and WSRC 1994). Under this waste forecast, modeling results indicate that none of the radionuclides analyzed would at any time exceed DOE's performance objective of 4 millirem per year for drinking water (Toblin 1995). The remaining trenches would be filled with stabilized waste forms (e.g., ashcrete) subject to completion of performance assessments and demonstration of compliance with the performance objectives required by DOE Order 5820.2A. Therefore, DOE has conservatively assumed that groundwater concentrations as a result of radioactive releases from the RCRA-permitted vaults and all other low-level waste disposal facilities (vaults and slit trenches) would remain within the DOE performance objective of 4 millirem per year adopted by DOE in Order 5400.5.
In summary, effects on groundwater
for alternative A - expected waste forecast would be very small and similar to
the effects discussed under the no-action alternative.

4.2.3.2 Groundwater Resources - Minimum Waste Forecast
For the minimum forecast, and as discussed in Section 4.1.3,
releases to groundwater from the disposal vaults would be improbable during
active maintenance; however, releases could eventually occur after the loss of
institutional control and degradation of the vaults. Impacts from the disposal
vaults would be similar to the effects under the no-action alternative (Section
4.1.3).
There would be four fewer additional low-activity and intermediate-level radioactive waste disposal vaults (11) than under the no-action alternative (15). Impacts of disposal in these vaults are similar to the impacts discussed in Section 4.1.3. Exceedance of the 4 millirem per year drinking water standard does not occur for any radionuclide in shallow groundwater at any time after disposal (Toblin 1995).
For this forecast there would be limited direct disposal of radioactive waste by shallow land disposal (25 additional slit trenches). Eleven (11) of these slit trenches would be used for disposal of suspect soil and have been evaluated using results from the previous Radiological Performance Assessment (Martin Marietta, EG&G, and WSRC 1994). Under this waste forecast, modeling results indicate that none of
the radionuclides analyzed would at any time exceed DOE's performance objective of 4 millirem per year for drinking water. The remaining trenches would be filled with stabilized waste forms (e.g., ashcrete) subject to completion of performance assessments and demonstration of compliance with the performance objectives required by DOE Order 5820.2A. Therefore, DOE has conservatively assumed that groundwater concentrations as a result of radioactive releases from the RCRA-permitted vaults and all other low-level waste disposal facilities (vaults and slit trenches) would remain within the DOE performance objective of 4 millirem per year adopted by DOE in Order 5400.5.
In summary, effects on groundwater
for alternative A - minimum waste forecast would be similar to the effects under
the no-action alternative (Section 4.1.3) and the effects for alternative A
- expected waste forecast.

4.2.3.3 Groundwater Resources - Maximum Waste Forecast
For the maximum forecast under alternative A, a total of 347
disposal vaults would have been constructed by 2024. However, these vaults
would have double liners and leak-detection and leachatecollection
systems, as required by RCRA (see Section 4.1.3). Therefore, despite the
large number of vaults required, releases to groundwater
would be improbable during active maintenance; however, releases could
eventually occur after loss of institutional control and degradation of the
vaults. Impacts from the RCRA-permitted disposal vaults would be similar to the
effects under the no-action alternative (Section 4.1.3). Potential effects on
groundwater resources due to the construction of RCRA-permitted disposal vaults
would be similar to the potential effects due to the construction of mixed-waste
storage buildings under the no-action alternative discussed in Section 4.1.3.
There would be more than four times the number of
low-activity and intermediate-level radioactive waste disposal vaults (62) than
under the no-action alternative (15). Predicted effects on
groundwater resources from low-activity and
intermediate-level radioactive waste disposal vaults would be similar to those
effects under the no-action alternative (Section 4.1.3); no radionuclide
would exceed the 4 millirem drinking water standard at any time after disposal
(Toblin 1995).
For the maximum forecast, 644 additional slit trenches would be needed to support shallow land disposal. Four hundred twenty six (426) of these slit would be used for disposal of suspect soil and have been evaluated using results from the previous Radiological Performance Assessment (Martin Marietta,
EG&G, and WSRC 1994). Under this waste forecast, modeling results indicate that none of the radionuclides analyzed would at any time exceed DOE's performance objective of 4 millirem per year from drinking water (Toblin 1995). The remaining trenches would be filled with stabilized waste forms (e.g., ashcrete) subject to completion of performance assessments and demonstration of compliance with the performance objectives required by DOE Order 5820.2A. Therefore, DOE has conservatively assumed that groundwater concentrations as a result of radioactive releases from the RCRApermitted vaults and all other low-level waste disposal facilities (vaults and slit trenches) would remain with the DOE performance objective of 4 millirem per year adopted by DOE in Order 5400.5.
In summary, predicted impacts to groundwater
for alternative A - maximum waste forecast would be similar to those under the
no-action alternative (Section 4.1.3) and alternative A - expected waste
forecast (Section 4.2.3.1).
4.2.4 SURFACE WATER RESOURCES

4.2.4.1 Surface Water Resources - Expected Waste Forecast
The impacts of the alternatives can be compared by examining
the pollutants that would be introduced to the surface waters. The effect of alternative A - expected waste
forecast on SRS streams would not differ from present effects, except that flow
rates of the discharged treated wastewater would
increase slightly.
As discussed in Section 4.1.4, construction of facilities
would require sedimentation and erosion control plans to
prevent adverse effects to streams by silt, oil/grease, or other pollutants that
could occur in runoff. Regular inspection of the implementation of these plans
would be performed as outlined in Section 4.1.4. After facilities were
operating, they would be included in the SRS Stormwater Pollution Prevention
Plan, and erosion and
pollution control measures would be implemented as indicated in this plan.
For alternative A - expected waste forecast, the M-Area Air Stripper, the M-Area Dilute Effluent Treatment Facility, and the F/HArea Effluent Treatment Facility would receive the same additional wastewater flows for treatment as those received in the no-action alternative . Each of these facilities has the design capacity to treat the additional flows and maintain discharge levels in compliance with
established permit conditions. The treated effluent from these facilities would, as explained in Section 4.1.4, continue to have little, if any, impact to receiving streams. Radionuclide concentrations would be the same as those reported for the no-action alternative. Drinking water doses due to stormwater infiltrating the vaults and trenches and draining to surface water would be many times lower than regulatory standards (Toblin 1995).
The Replacement High-Level Waste Evaporator (as noted under
the no-action alternative) would evaporate the liquid waste from the high-level
waste tanks in the F- and H-Area tank farms. It would be used in the same
manner as the present F and H-Area evaporators,
with the distillate being sent to the F/H-Area Effluent Treatment Facility for
treatment prior to being discharged to Upper Three Runs. The concentrate from
the evaporator would be sent to the Defense Waste Processing Facility for vitrification.
Since the Replacement High Level Waste Evaporator would be used in the same
manner as the existing evaporators and would produce a distillate similar in
composition to the present distillate, the effect of the F/H-Area Effluent
Treatment Facility effluent on Upper Three Runs would be
the same as it is now.
Wastewater from the containment building would be transferred to the Consolidated Incineration
Facility for treatment. The
containment building would not discharge to a stream.
Wastewater discharges would not occur from
the mobile soil sort facility under this alternative.

4.2.4.2 Surface Water Resources - Minimum Waste Forecast
The M-Area Dilute Effluent Treatment Facility would receive
the same additional wastewater flow for treatment as
under the no-action alternative. The M-Area Air Stripper and the F/H-Area
Effluent Treatment Facility would each receive approximately 0.4 gallon (1.5
liters) per minute less than that sent to each facility under the no-action
alternative. As explained in Section 4.1.4, the treated effluent from
these facilities would continue to have little, if any, impact on receiving
streams. Each facility has the necessary capacity to treat the additional
wastewater and maintain discharges in compliance with established permit
conditions. Also, because of less waste disposal, groundwater
discharging to surface water would have a very
small impact (Toblin 1995). Drinking water doses due to stormwater infiltrating
waste disposal vaults and trenches and draining to surface waters would be many
times lower than regulatory standards.
As discussed in Section 4.1.4, erosion
and sedimentation control plans would be prepared
and implemented for the construction projects, and the operators of the
facilities would be required to abide by the SRS Pollution Prevention Plan.

4.2.4.3 Surface Water Resources - Maximum Waste Forecast
Storage and disposal facilities would be as described in
Section 4.2.4.1. Surface waters would not be affected by operation of these
facilities.
For the maximum waste forecast, wastewater
from the containment building would not be
transferred to the Consolidated Incineration Facility because that facility could not handle the increased
volume. A new wastewater treatment facility would be installed to treat this
wastewater to meet outfall discharge limits established by SCDHEC.
The average flow rate for this discharge would be approximately 11 liters
(2.9 gallons) per minute. The dose to the offsite maximally exposed
individual would be 2.1
´
10-5
millirem (Appendix E). The flow of properly treated
water would not affect the water quality of the receiving stream.
The M-Area Air Stripper and the M-Area Dilute Effluent
Treatment Facility would receive approximately the same additional wastewater
flows as under the no-action alternative. The F/H-Area Effluent Treatment
Facility would receive additional wastewater flow of 0.28 gallon (1.1 liter)
per minute above that for the no-action alternative. The facilities have the
capacity to treat the additional flow.
Stormwater infiltrating the disposal vaults and trenches
would drain to surface water at concentrations
many times less than regulatory standards (Toblin 1995).
Erosion and sediment control during
construction projects and pollution prevention plans after operations begin would be required, as discussed in
Section 4.1.4.
4.2.5 AIR RESOURCES

4.2.5.1 Air Resources - Expected Waste Forecast
Impacts to air can be compared among the alternatives by
evaluating the pollutants introduced to the air. Under alternative A expected
waste forecast, DOE would continue ongoing and planned waste treatment
activities and construct and operate the additional facilities identified in
Section 4.2.1. Additional nonradiological and radiological emissions would come
from these facilities. The resulting increases of pollutant concentrations at
and beyond the SRS boundary would be very small compared to existing
concentrations. Operations for alternative A - expected waste forecast would
not exceed state or Federal air quality standards.
4.2.5.1.1 Construction
Potential impacts to air quality
from construction activities would include fugitive dust (particulate matter)
and exhaust from earth-moving equipment. For this case, approximately 5.73´105cubic meters (7.50´105
cubic yards) of soil in E-Area would be moved. Fugitive
dust emissions for alternative A - expected waste forecast were estimated using
the calculations described in Section 4.1.5.1.
Maximum SRS boundary-line concentrations of air pollutants
from a year of average construction activity are shown in Table 4-16. The sum
of the incremental increases of pollutant concentrations due to construction and
the existing baseline concentrations would be within both state and Federal air
quality standards.
4.2.5.1.2 Operations
In addition to the current emissions from SRS,
nonradiological and radiological emissions would occur due to the operation of
new facilities such as the Defense Waste Processing Facility, including In-Tank Precipitation; the MArea Vendor
Treatment Facility; the Consolidated Incineration Facility; the mixed waste
containment building; mixed waste soil sort facility; and the transuranic waste characterization/
certification facility. Air emissions from facilities
such as disposal vaults and mixed waste storage buildings would be very small.
According to the rationale provided about similar facilities
contained in Section 4.1.5.2, increases in maximum boundary-line concentrations
of pollutants would not result from the continued operation of the F and
H-Area tank farm evaporators, the F/H-Area Effluent Treatment
Facility, the scrap-lead melter, solvent distillation units, the silver recovery
unit, the Organic Waste Storage Tank, Savannah River
Technology Center ion exchange process, low-level
waste compactors, or the M-Area Air Stripper.
Additional emissions from the M-Area Air Stripper and the F/H-Area Effluent
Treatment Facility would be very small, as addressed in Section 4.1.5.2.
Nonradiological Air Emissions Impacts
Maximum ground-level concentrations for nonradiological air pollutants were determined from the Industrial Source Complex Version 2 Dispersion Model using maximum potential emissions from all the facilities included in alternative A (Stewart 1994). The bases for calculating the dispersion of toxic substances that are carcinogenic are presented in Section 4.1.5.2. Modeled air toxic concentrations for carcinogens are based on an annual averaging period and are presented in Section 4.2.12.2.2.
The methodology for calculating an annual averaging period is
presented in Section 4.1.5.2.1. Air dispersion modeling was performed
using calculated emission rates for facilities not yet operating and actual 1990
emission levels for facilities currently operating (Stewart 1994).
The following facilities were incorporated in the modeling
analysis for alternative A air dispersion: the Consolidated Incineration
Facility, including the ashcrete
storage silo, the ashcrete hopper duct, and the ashcrete mixer; four new solvent
tanks at the Consolidated Incineration Facility; the Defense Waste Processing
Facility, including In-Tank
Precipitation; the M-Area Vendor Treatment Facility; the mixed waste containment building; the
transuranic waste
characterization/certification facility; hazardous waste storage facilities; and mixed waste storage facilities.
Emissions of air toxics would be very small. Maximum
boundary-line concentrations for air toxics emanating from SRS sources,
including the Consolidated Incineration Facility and the Defense Waste Processing Facility, would be well below regulatory standards and are
presented in the SCDHEC Regulation No. 62.5 Standard No. 2 and Standard No.
8 Compliance Modeling Input/Output Data.
The Savannah River Technology Center
laboratory's liquid waste and the E-Area vaults would have very small air
emissions, as described in Section 4.1.5.2.
Table 4-17 shows the increase in maximum ground-level
concentrations at the SRS boundary for nonradiological air pollutants due to
treating the expected, minimum, and maximum waste forecasts under alternative A.
Concentrations at the SRS boundary would be within both
state and Federal ambient air quality regulations.
Minimal health effects would occur to the
public due to routine emissions.
Offsite lead decontamination operations (described in
Appendix B.21) would result in a maximum ground-level 3-month concentration
of 0.008 micrograms per cubic meter for all alternatives and forecasts, less
than the 0.011 micrograms per cubic meter background concentrations of lead in
the SRS area (EPA 1990). Both the concentrations at the offsite facility and at
SRS are less than 1 percent of the SCDHEC regulatory standard (SCDHEC 1976).
Impacts would be very small.
Radiological Air Emissions Impacts
Offsite maximally exposed individual and population
doses were determined for atmospheric releases resulting from routine operations
under alternative A. The major sources of radionuclides would be the
Consolidated Incineration Facility (mixed waste only), the transuranic waste
characterization/certification facility, and the F/H-Area Effluent
Treatment Facility. Other facilities with radiological releases would be the
M-Area Vendor Treatment Facility, the mixed waste containment building, and the
soil sort facility.
SRS-specific computer codes MAXIGASP and POPGASP were used
to determine the maximum individual dose and the dose to the population
within an 80-kilometer (50-mile) radius of SRS respectively, from routine
atmospheric releases. See Appendix E for detailed facility-specific isotopic
and dose data.
Table 4-18 shows the dose to the offsite maximally exposed
individual and the population from atmospheric
pathways. The calculated maximum committed effective annual dose equivalent
(see glossary for definitions of dose, dose equivalent, effective dose, and
committed effective dose equivalent) to a hypothetical individual would be 0.011 millirem
(Chesney 1995), which is 1,000 times less than the annual dose limit of 10
millirem from SRS atmospheric releases. In comparison, an individual living
near SRS receives a dose of 0.25 millirem from all current SRS releases of
radioactivity (Arnett 1994). The 0.011 millirem annual dose is greater than the
1.3´10-4millirem dose shown for the no-action
alternative.
The annual dose to the population within 80 kilometers (50 miles) of SRS from treatment of the expected amount of waste would be 0.56 person-rem. This dose is greater than the population dose of 2.9×10⁻⁴for the no-action alternative. In comparison, the collective dose received by the same population from natural sources of radiation is approximately 195,000 person-rem (Arnett, Karapatakis, and Mamatey 1994). Section 4.2.12.1.2 describes the potential health effects of these releases.
Table 4-18. Annual radiological doses to individuals and the population within 80 kilometers (50miles) of SRS from atmospheric pathways under alternative A.a
| Waste forecast | Offsite maximally exposed individual dose (millirem) |
Populationb
dose (person-rem) |
| Expected waste forecast | 0.011 | 0.56 |
| Minimum waste forecast | 0.0057 | 0.27 |
| Maximum waste forecast | 0.080 | 3.4 |
a. Source: Chesney (1995).
b. For atmospheric releases, the dose is to the population within 80 kilometers (50 miles) of SRS.

4.2.5.2 Air Resources - Minimum Waste Forecast
4.2.5.2.1 Construction
Impacts were evaluated for the construction of storage,
treatment, and disposal facilities listed in
Section 2.4.7. Maximum
concentrations at the SRS boundary resulting from a year of average construction
activity are shown in Table 4-16 for alternative A - minimum waste forecast.
Constructionrelated emissions would yield SRS boundary-line concentrations
less than both state and Federal air quality
standards.
4.2.5.2.2 Operations
Both radiological and nonradiological emission changes were
determined for the same facilities listed in Section 4.2.5.1.2. Air emissions would be less than those for the expected waste forecast.
Nonradiological Air Emission Impacts
Nonradiological air emissions
would be only slightly less than those for the expected waste forecast. Maximum
SRS boundaryline concentrations are presented in Table 4-17. Modeled
concentrations are similar to those shown for the expected waste forecast and
under the no-action alternative (Table 4-17). Total concentrations would be
less than applicable state and Federal ambient air quality standards.
Radiological Air Emission Impacts
Table 4-18 presents the dose to the offsite maximally
exposed individual and the population due to
atmospheric releases. The calculated maximum committed annual dose equivalent
to a hypothetical individual is 0.0057 millirem (Chesney 1995), which is less
than the dose for the expected waste forecast and well below the annual dose
limit of 10 millirem from SRS atmospheric releases.
The annual dose to the population
within 80 kilometers (50 miles) of SRS would be 0.27 person-rem, which is less
than the population dose calculated for the expected waste forecast.

4.2.5.3 Air Resources - Maximum Waste Forecast
Alternative A - maximum waste forecast would have greater
air quality impacts than the expected waste
forecast.
4.2.5.3.1 Construction
Impacts were evaluated for the construction of storage,
treatment, and disposal facilities listed in Section 2.4.7. Maximum
concentrations at the SRS boundary resulting from a year of average construction
activity are presented in Table 4-16 for the maximum waste forecast.
Constructionrelated concentrations would yield SRS boundary concentrations
less than both state and Federal air quality
standards.
4.2.5.3.2 Operations
Both radiological and nonradiological emissions increases
were determined for the same facilities listed in Section 4.2.5.1.2. Air
emissions would be greater than in the expected waste
forecast; therefore, impacts to air quality would
be greater. However, they would remain within state and Federal ambient air
quality standards.
Nonradiological Air Emissions Impacts
Nonradiological air emissions
would be slightly higher than those associated with the expected waste forecast.
Maximum concentrations at the SRS boundary are presented in Table 4-17.
Modeled concentrations are similar to those for the expected waste forecast.
Cumulative concentrations would be below applicable state and Federal ambient
air quality standards.
Radiological Air Emission Impacts
Offsite maximally exposed individual and population
doses were determined for atmospheric releases resulting from routine operations
at the facilities identified in Section 4.2.5.1.2.
Table 4-18 shows the dose to the offsite maximally exposed individual and to the population due to atmospheric releases. The calculated maximum committed annual dose equivalent to a hypothetical individual is 0.080 millirem (Chesney 1995), which would be greater than the dose from the expected waste forecast but well below the annual dose limit of 10 millirem from SRS atmospheric releases.
The annual dose to the population
within 80 kilometers (50 miles) of SRS would be 3.4 person-rem, which would be
greater than the population dose calculated for the expected waste forecast.
Section 4.2.12.1.2 describes the potential health effects of these releases.
4.2.6 ECOLOGICAL RESOURCES

4.2.6.1 Ecological Resources - Expected Waste Forecast
Construction of new waste treatment, storage, and disposal
facilities for alternative A - expected waste forecast would result in the
clearing and grading of undisturbed areas. (These areas are given in acres; to
convert to square kilometers, multiply by 0.004047.) Sixty-four acres of
woodland would be cleared and graded by 2006 and an additional 32 acres
would be needed by 2024, as follows:
- 27 acres of loblolly pine planted in 1987
- 15 acres of white oak, red oak, and hickory regenerated in 1922
- 18 acres of longleaf pine regenerated in 1922, 1931, or 1936
- 4 acres from which mixed pine/hardwood was recently harvested
- 20 acres of loblolly pine planted in 1987 would be cleared between 2007 and 2024
- 3 acres of loblolly pine planted in 1946 would be cleared between 2007 and 2024
- 9 acres of longleaf pine planted in 1988 would be
cleared between 2007 and 2024
Effects on the ecological resources are described in Section
4.1.6; however, because less land would be required for this case (96 acres
versus 160 under the no-action alternative), the overall impact due to loss of
habitat would be less. For example, fewer animals would be displaced or
destroyed.

4.2.6.2 Ecological Resources - Minimum Waste Forecast
Approximately 73 acres of undeveloped land located between
the M-Line railroad and the E-Area expansion and extending northwest of F-Area
would be required. Because less undeveloped land would be required under this
waste forecast, impacts to the ecological resources of the area would be
slightly less than for the expected waste forecast.

4.2.6.3 Ecological Resources - Maximum Waste Forecast
Approximately 184 acres of undeveloped land located between
the M-Line railroad and the developed portion of E-Area and extending northwest
of F-Area would be required for the maximum waste forecast. By 2006, an
additional 802 acres of undeveloped land in an undetermined location would
also be required. Impacts to the ecological resources of SRS under this
forecast would be approximately 7 times greater than the impacts described
in Section 4.1.6 due to the greater acreage required. For example, many more
animals would be destroyed or displaced during clearing of this much land. Loss
of cover from several hundred acres in a watershed can alter the water chemistry
of the creeks in the drainage, which in turn could influence the kinds of
organisms that live in the streams.
Wetlands constitute nearly 21 percent of SRS (DOE 1991). Should the maximum amount of waste be treated, and 802 acres of additional land be required, it is probable that some sites needed for the expansion could contain wetlands. Additionally, a large portion of SRS soils are on steep slopes and
highly erodible, with conditions so difficult to overcome that special facility designs, substantial increases in construction costs, and increased maintenance costs would be required (WSRC 1994c). Soils on the steep slopes adjacent to E-Area would be avoided under all alternatives due to these construction and maintenance problems. It is likely that a portion of a site selected for additional waste management construction would contain some unsuitable soils. Threatened and endangered species and significant historic and pre-historic cultural resources are also found throughout SRS and could occur on portions of any site selected for additional waste management facilities. Because of these considerations, it is likely that a tract of land substantially larger than 802 acres would be needed to provide the required acreage. Threatened and endangered species surveys and floodplains and wetland assessments would be required before final site selection.
4.2.7 LAND USE

4.2.7.1 Land Use - Expected Waste Forecast
DOE would use approximately 0.52 square kilometer (64 acres
of undeveloped; 65 acres of developed) land in E-Area through 2006 for
activities associated with alternative A - expected waste forecast. By 2024,
0.61 square kilometer (152 acres) would be required, about 89 acres less than
under the no-action alternative. SRS has about 181,000 acres of undeveloped
land, which includes wetlands and other areas that cannot
be developed, and 17,000 acres of developed land.
Activities associated with alternative A would not affect
current SRS land-use plans; E-Area was designated as an area for nuclear
facilities in the draft 1994 Land-Use Baseline Report. Furthermore, no
part of E-Area has been identified as a potential site for future new missions.
According to the
FY 1994 Draft Site Development Plan, proposed future land
management plans specify that E-Area should be characterized and remediated for
environmental contamination in its entirety, if necessary. Decisions on future
SRS land uses will be made by DOE through the site
development, land-use, and future-use planning processes, including public input
through avenues such as the Citizens Advisory Board.

4.2.7.2 Land Use - Minimum Waste Forecast
Activities associated with alternative A - minimum waste
forecast would not affect current SRS land uses. By
2024, approximately 0.44 square kilometer (108 acres; slightly less acreage
than would be required in the expected waste forecast) in E-Area would be used
for the facilities described in
Section 4.2.1.

4.2.7.3 Land Use - Maximum Waste Forecast
Activities associated with alternative A - maximum waste
forecast would not affect current SRS land uses. By
2006, DOE would need a total of 1.03 square kilometers (254 acres) in E-Area and
3.24 square kilometers (802 acres) elsewhere for the facilities described
in Section 4.2.1. This acreage is nearly 10 times the land that would be
required for the expected or minimum waste forecast, but less than 1 percent
of the total undeveloped land on SRS (DOE 1993d). However, considerably more
acreage than this may be affected (see Section 4.2.6.3). Current land uses in EArea
would not be impacted. The location of the 3.24 square kilometers (802 acres)
outside of EArea has not been identified and the site selection would
involve further impact analyses. However, DOE would minimize the impact of
clearing 3.24 square kilometers (802 acres) by locating these facilities within
the central industrialized portion of SRS, as described in Section 2.1.2 and
shown in Figure 21.
4.2.8 SOCIOECONOMICS
This section describes the potential effects of implementing
alternative A on the socioeconomic resources in the region of influence
discussed in Section 3.8. This assessment is based on the estimated
construction and operations employment required to
implement this alternative.

4.2.8.1 Socioeconomics- Expected Waste Forecast
4.2.8.1.1 Construction
Table 4-19 shows the estimated construction employment
associated with the expected waste forecast for this alternative. DOE
anticipates that construction employment would peak during 2003 through 2005
with approximately 80 jobs, 30 more jobs than during peak employment under the
no-action alternative. This employment demand represents much less than 1 percent
of the forecast employment in 2005. Given the normal fluctuation of employment
in the construction industry, DOE does not expect a net change in regional
construction employment from implementation of this forecast. Given no net
change in employment, neither the population nor
personal income in the region would change. As a result,
socioeconomic resources would not be affected.
4.2.8.1.2 Operations
Operations employment associated
with implementation of the expected waste forecast under this alternative is
expected to peak from 2008 through 2018 with an estimated 2,560 jobs, 110 more
jobs than during peak employment under the no-action alternative. This
employment demand represents less than 1 percent of the forecast employment in
2015 (see Chapter 3) and approximately 12 percent of 1995 SRS employment. DOE
believes these jobs would be filled from the existing SRS workforce. Thus, DOE
anticipates that socioeconomic resources would not be affected by changes in
operations employment.

4.2.8.2 Socioeconomics-- Minimum Waste Forecast
4.2.8.2.1 Construction
Construction employment associated with the minimum waste forecast under this alternative would be slightly less than that for the expected waste forecast and would peak during 2003 through 2005 with approximately 70 jobs, which represents much less than 1 percent of the forecast employment in 2005. Socioeconomic resources in the region would not be affected.
Table 4-19. Estimated construction and operations employment for alternative A - expected, minimum, and maximum waste forecasts. a
|
| ||||||||
|
|
|
| ||||||
| Year | Construction | Operations | Construction | Operations | Construction | |||
| 1995 | 20 | 920 | 50 | 1,650 | 290 | |||
| 1996 | 20 | 1,150 | 30 | 1,920 | 80 | |||
| 1997 | 20 | 1,150 | 30 | 1,920 | 80 | |||
| 1998 | 20 | 1,150 | 40 | 2,060 | 190 | |||
| 1999 | 20 | 1,150 | 40 | 2,170 | 190 | |||
| 2000 | 20 | 1,230 | 40 | 2,280 | 190 | |||
| 2001 | 20 | 1,230 | 40 | 2,280 | 190 | |||
| 2002 | 30 | 1,310 | 60 | 2,330 | 230 | |||
| 2003 | 70 | 1,350 | 80 | 2,330 | 260 | |||
| 2004 | 70 | 1,350 | 80 | 2,330 | 260 | |||
| 2005 | 70 | 1,350 | 80 | 2,330 | 260 | |||
| 2006 | 40 | 1,430 | 60 | 2,270 | 210 | |||
| 2007 | 20 | 1,390 | 40 | 2,190 | 80 | |||
| 2008 | 20 | 1,680 | 40 | 2,560 | 160 | |||
| 2009 | 20 | 1,610 | 40 | 2,560 | 160 | |||
| 2010 | 20 | 1,610 | 40 | 2,560 | 160 | |||
| 2011 | 20 | 1,610 | 40 | 2,560 | 160 | |||
| 2012 | 20 | 1,610 | 40 | 2,560 | 160 | |||
| 2013 | 20 | 1,610 | 40 | 2,560 | 160 | |||
| 2014 | 20 | 1,610 | 40 | 2,560 | 160 | |||
| 2015 | 20 | 1,610 | 40 | 2,560 | 160 | |||
| 2016 | 20 | 1,610 | 40 | 2,560 | 160 | |||
| 2017 | 20 | 1,610 | 40 | 2,560 | 160 | |||
| 2018 | 20 | 1,610 | 40 | 2,560 | 160 | |||
| 2019 | 20 | 1,310 | 40 | 2,190 | 80 | |||
| 2020 | 20 | 1,310 | 40 | 2,190 | 80 | |||
| 2021 | 20 | 1,310 | 40 | 2,190 | 80 | |||
| 2022 | 20 | 1,310 | 40 | 2,190 | 80 | |||
| 2023 | 20 | 1,310 | 40 | 2,190 | 80 | |||
| 2024 | 20 | 1,310 | 40 | 2,190 | 80 | |||
a. Source: Hess (1995a, b).
b. Operations employment for the maximum waste forecast is provided in Table 4-20.
4.2.8.2.2 Operations
Operations employment associated
with implementation of the minimum waste forecastis expected to peak in
the year 2008 with an estimated 1,680 jobs, 880 fewer jobs than for the expected
waste forecast. This employment demand represents less than 1 percent of the
forecast employment in 2008 and approximately 8 percent of 1995 SRS employment.
DOE believes these jobs would be filled from the existing SRS workforce and
anticipates that socioeconomic resources from changes in operations employment
would not be affected.

4.2.8.3 Socioeconomics- Maximum Waste Forecast
4.2.8.3.1 Construction
Construction employment
associated with alternative A - maximum waste forecastwould be
greater than that for the expected waste forecastand would peak during
2003 through 2005 with approximately 260 jobs, which represents much less than 1
percent of the forecast employment in 2005. DOE does not expect a net change in
regional construction employment from implementation of this case. As a result,
socioeconomic resources in the region would not be affected.
4.2.8.3.2 Operations
Operations employment associated
with implementation of alternative A - maximum waste forecast is
expected to peak during 2002 through 2005 with an estimated 11,200 jobs (Table 420),
which represents 4 percent of the forecast employment in 2005 and approximately
56 percent of 1995 SRS employment. DOE assumes that approximately 50 percent of
the total SRS workforce would be available to support the implementation of this
case. If DOE transfers 50 percent of the SRS workforce, an additional 3,300 new
employees would still be required during the peak years. Based on the number of
new jobs predicted, DOE calculated changes in regional employment, population,
and personal income using the Economic-Demographic
Forecasting and Simulation Model developed for the six-county region of
influence (Treyz, Rickman, and Shao 1992).
Results of the modeling indicate that the peak regional
employment change would occur in 2002 with a total of
approximately 7,540 new jobs (Table 4-21) (HNUS 1995b). This would represent a
3 percent increase in baseline regional employment and would have a substantial
positive impact on the regional economy.
Potential changes in regional population would lag behind the peak change in employment because of migration lags and also because in-migrants may have children after they move into the area. As a result, the maximum change in population would occur in 2005 with an estimated 12,900 additional people in the six-county region (HNUS 1995b). This increase is approximately 2.7 percent above the baseline regional population forecast (Table 4-21) and could affect the demand for community resources and services such as housing, schools, police, health care, and fire protection.
Potential changes in total personal income would peak in 2005 with a $610 million increase over forecast income levels for that year (HNUS 1995b). This would be a 4 percent increase over baseline income levels (Table 4-21) and would have a substantial, positive effect on the regional economy.
Table 4-20. Estimated new operations jobs required to support the alternative A - maximum waste forecast.a
|
|
|
|
|
||
| 1995 | 20,000 | 10,000 | 2,620 | 0 | |
| 1996 | 15,800 | 7,900 | 4,420 | 0 | |
| 1997 | 15,800 | 7,900 | 4,730 | 0 | |
| 1998 | 15,800 | 7,900 | 10,200 | 2,300 | |
| 1999 | 15,800 | 7,900 | 10,490 | 2,590 | |
| 2000 | 15,800 | 7,900 | 10,510 | 2,610 | |
| 2001 | 15,800 | 7,900 | 10,510 | 2,610 | |
| 2002 | 15,800 | 7,900 | 11,200 | 3,300 | |
| 2003 | 15,800 | 7,900 | 11,200 | 3,300 | |
| 2004 | 15,800 | 7,900 | 11,200 | 3,300 | |
| 2005 | 15,800 | 7,900 | 11,200 | 3,300 | |
| 2006 | 15,800 | 7,900 | 10,040 | 2,140 | |
| 2007 | 15,800 | 7,900 | 4,600 | 0 | |
| 2008 | 15,800 | 7,900 | 9,060 | 1,160 | |
| 2009 | 15,800 | 7,900 | 9,060 | 1,160 | |
| 2010 | 15,800 | 7,900 | 9,060 | 1,160 | |
| 2011 | 15,800 | 7,900 | 9,060 | 1,160 | |
| 2012 | 15,800 | 7,900 | 9,060 | 1,160 | |
| 2013 | 15,800 | 7,900 | 9,060 | 1,160 | |
| 2014 | 15,800 | 7,900 | 9,060 | 1,160 | |
| 2015 | 15,800 | 7,900 | 9,060 | 1,160 | |
| 2016 | 15,800 | 7,900 | 9,060 | 1,160 | |
| 2017 | 15,800 | 7,900 | 9,060 | 1,160 | |
| 2018 | 15,800 | 7,900 | 9,060 | 1,160 | |
| 2019 | 15,800 | 7,900 | 4,600 | 0 | |
| 2020 | 15,800 | 7,900 | 4,600 | 0 | |
| 2021 | 15,800 | 7,900 | 4,600 | 0 | |
| 2022 | 15,800 | 7,900 | 4,600 | 0 | |
| 2023 | 15,800 | 7,900 | 4,600 | 0 | |
| 2024 | 15,800 | 7,900 | 4,600 | 0 | |
a. Source: Hess (1995a, b).
b. DOE assumed that approximately 50 percent of the total SRS workforce would be available to support waste management activities.
c. New hires are calculated by comparing the required employment (column 4) to available employment (column 3); new hires would be needed only in those years when required employment exceeds available employees.
Table 4-21. Changes in employment, population, and personal income for alternativeA maximum waste forecast.a
Table 4-21. Changes in employment, population, and personal income for alternative A - maximum waste forecast.a
indirect regional employmentc | change in total regional employment |
| ||||||
| 2,300 | 3,300 | 5,600 | 1,960 | 0.42 | 270 | 2.60 | ||
| 2,590 | 3,640 | 6,230 | 4,600 | 0.97 | 340 | 3.09 | ||
| 2,610 | 3,490 | 6,100 | 6,380 | 1.34 | 370 | 3.18 | ||
| 2,610 | 3,330 | 5,940 | 7,770 | 1.63 | 390 | 3.16 | ||
| 3,300 | 4,240 | 7,540 | 9,460 | 1.98 | 520 | 3.98 | ||
| 3,300 | 4,100 | 7,400 | 11,020 | 2.30 | 550 | 3.96 | ||
| 3,300 | 3,990 | 7,290 | 12,080 | 2.52 | 580 | 3.94 | ||
| 3,300 | 3,920 | 7,220 | 12,900 | 2.69 | 610 | 3.91 | ||
| 2,140 | 2,170 | 4,310 | 12,490 | 2.60 | 430 | 2.59 | ||
| 0 | 3,060 | 3,060 | 11,270 | 2.34 | 340 | 1.92 | ||
| 1,160 | 760 | 1,920 | 9,880 | 2.04 | 240 | 1.27 | ||
| 1,160 | 910 | 2,070 | 8,690 | 1.79 | 240 | 1.20 | ||
| 1,160 | 1,070 | 2,230 | 7,850 | 1.61 | 250 | 1.17 | ||
| 1,160 | 1,220 | 2,380 | 7,170 | 1.47 | 260 | 1.15 | ||
| 1,160 | 1,340 | 2,500 | 6,630 | 1.35 | 280 | 1.17 | ||
| 1,160 | 1,450 | 2,610 | 6,200 | 1.26 | 310 | 1.22 | ||
| 1,160 | 1,530 | 2,690 | 5,850 | 1.18 | 330 | 1.22 | ||
| 1,160 | 1,600 | 2,760 | 5,560 | 1.12 | 360 | 1.25 | ||
| 1,160 | 1,650 | 2,810 | 5,310 | 1.06 | 380 | 1.25 | ||
| 1,160 | 1,680 | 2,840 | 5,100 | 1.02 | 410 | 1.27 | ||
| 1,160 | 1,710 | 2,870 | 4,920 | 0.98 | 440 | 1.29 |
a. Source: Hess (1995a, b); HNUS (1995b).
b. From Table 4-20.
c. Change in employment related to changes in population.
4.2.9 CULTURAL RESOURCES
This section discusses the effect of alternative A on
cultural resources.

4.2.9.1 Cultural Resources - Expected Waste Forecast
Waste treatment, storage, and disposal facilities would be
constructed within the currently developed portion of E-Area, to the north and
northwest of this area, and to the northwest of F-Area (see Figures 413
and 4-14).
Construction within the developed and fenced portion of
E-Area would not affect cultural or archaeological resources because this area
has been previously disturbed.
Two small areas of unsurveyed land to the east and northeast
of the currently developed portion of EArea that would be used for the
construction of sediment ponds (see Figure 4-5) would be surveyed before
beginning construction. If important resources were discovered, DOE would avoid
them or remove them.
Construction of the RCRA-permitted disposal vaults to the
northwest of the currently developed portion of E-Area (see Figure 4-13) would
not affect archaeological resources because when this area was surveyed
important sites were not discovered.
Archaeological sites in the area of expansion could be impacted as described in Section 4.1.9. If this occurred, DOE would protect these resources as described in Section 4.1.9.

4.2.9.2 Cultural Resources - Minimum Waste Forecast
Construction of new waste management storage facilities for
this forecast would require approximately 0.18 fewer square kilometer (44 fewer
acres) than that for the expected waste forecast. Although the precise
configuration of facilities is currently undetermined, construction would take
place within previously disturbed parts of E-Area.
As discussed in Section 4.2.9.1, construction within the
developed and fenced portion of E-Area or to the northwest of this area would
not have an effect on archaeological resources. Before construction would begin
in the undeveloped area northwest of F-Area, the Savannah River Archaeology Research Program and DOE would complete the consultation
process with the State Historic Preservation Officer and develop mitigation
action plans to ensure that important archaeological resources would be
protected and preserved (Sassaman 1994).

4.2.9.3 Cultural Resources - Maximum Waste Forecast
Construction of new waste management storage, treatment, and
disposal facilities for this forecast would require approximately 4.27 square
kilometers (1,056 acres), 3.66 kilometers (904 acres) more than
for the expected waste forecast. Some of the new facilities would be sited
within EArea; however, DOE would need an estimated additional 3.24 square
kilometers (802 acres) outside of EArea.
Construction within the developed and fenced portion of
E-Area or to the northwest of this area would be preceded by consultation with
the State Historic Preservation Officer and the development of a mitigation plan
to ensure that archaeological resources would be protected.
Until DOE determines the precise location of the additional
3.24 square kilometers (802 acres) that would be used outside of
E-Area, effects on cultural resources
cannot be predicted. The potential disturbance of important cultural resources
would be proportional to the amount of land disturbed. However, in compliance
with the Programmatic Memorandum of Agreement, DOE would survey areas proposed
for new facilities prior to disturbance. If important resources were
discovered, DOE would avoid or remove them.


4.2.10 AESTHETICS AND SCENIC RESOURCES - EXPECTED, MINIMUM, AND MAXIMUM WASTE FORECASTS
Activities associated with alternative A - expected,
minimum, and maximum waste forecasts would not adversely affect scenic
resources or aesthetics. E-Area is already dedicated to industrial use. In all
cases, new construction would not be visible from off SRS or from public access
roads on SRS. The new facilities would not produce emissions that would be
visible or that would indirectly reduce visibility.
4.2.11 TRAFFIC AND TRANSPORTATION
4.2.11.1 Traffic

4.2.11.1.1 Traffic - Expected Waste Forecast
The additional traffic under alternative A - expected
waste forecast (Table 4-22) would result from construction activities.
The increase would be greatest in 2003, when the greatest number of people would
be employed. In the table, the additional traffic is distributed among offsite
roads based on the percentage of baseline traffic each road carries. Traffic on
all roads would remain within design capacity, and the effects of increased
traffic would be very small.
Additional truck traffic due to increased construction
activities was estimated to be fewer than 10 trucks per day for all
alternatives (Hess 1994d). DOE would not expect this increase in constructionrelated
truck traffic during normal working hours to adversely affect traffic;
therefore, it will not be discussed in subsequent sections.
For the expected waste forecast, there would be two additional waste shipments per day over the noaction estimates (Table 4-23). This would be due to shipments of stabilized ash and blowdown from
the Consolidated Incineration Facility to disposal facilities. DOE would not expect the additional truck traffic during normal working hours to adversely affect traffic. Numbers of shipments assumed under each alternative are given in Tables E.3-1 through E.3-3.
Table 4-22. Number of vehicles per hour during peak hours under alternative A.
Table 4-23. SRS daily hazardous and radioactive waste shipments by truck under alternative A.a

4.2.11.1.2 Traffic - Minimum Waste Forecast
For the minimum waste forecast, there would be 21 more
vehicles than in the no-action alternative during peak commuter hours (Table
4-22). Traffic on all roads would remain within design capacity. The effects
of traffic under this case would be very small. There would be 13 fewer waste
shipments per day compared to noaction estimates (Table 4-23). This
decrease is due to smaller volumes of all types of waste. The lower volume of
truck traffic would result in a slightly positive effect on traffic.

4.2.11.1.3 Traffic - Maximum Waste Forecast
As discussed in Section 4.1.11.1, the 1992 highway fatality
rate of 2.3 per 100 million miles driven in South Carolina provides a
baseline estimate of 5.5 traffic fatalities annually. Under alternative A, the
largest increase in construction workers would occur for the maximum waste
forecast (211 more workers than under the no-action alternative). These
workers would be expected to drive 2.6 million miles annually (2.1 million miles
more than under the no-action alternative), which would result in less than one
additional traffic fatality per year.
Even with the addition of 211 vehicles above the estimates
under the no-action alternative, traffic on all roads would remain within design
carrying capacity; therefore, effects on traffic would be very small. Depending
on the areas to which these employees were assigned and the shifts they worked,
DOE would need to examine the design capacity of the affected roads.
Daily waste shipments would increase by 58 (Table 4-23), primarily due to overall increases in waste volumes and shipment of stabilized ash and blowdown to disposal facilities. The shipments would originate at various SRS locations (primarily F- and H-Areas) and terminate at the E-Area treatment and disposal facilities. Shipments from the transuranic waste characterization/certification facility and containment building would not affect traffic because these shipments would occur on a dedicated road that would be upgraded to accommodate expected traffic flows. The addition of 58 trucks during normal working hours is expected to have very small adverse effects on traffic.
4.2.11.2 Transportation

4.2.11.2.1 Transportation - Expected Waste Forecast
Consequences from incident-free onsite transportation over
30 years under alternative A were based on those under the no-action
alternative, adjusted by the changes in the number of waste shipments (as a
result of changes in volumes of waste shipped). The percent change in dose from
the no-action alternative and corresponding health effects are shown in Table 4-24 for incident-free
transportation. Consequences of onsite transportation accidents
for any given shipment are independent of the number of shipments and are,
therefore, the same as for the no-action alternative (Table 4-8).
Table 4-24. Annual dose (percent change from the no-action alternative) and associated excess latent cancer fatalities from incident-free onsite transport of radioactive material for alternative A - expected waste forecast.
Doses from incident-free offsite shipments of mixed wastes were calculated as in Section 4.1.11.2 using calculated
external dose rates 1 meter (3.3 feet) from the transport vehicle for each waste
and package type (HNUS 1995a). Additionally, occupational exposure time depends
on the number of shipments and how long it takes to load each transport vehicle.
The results are shown in Table 4-25.
Table 4-25. Annual dose and excess latent cancer fatalities from incident-free offsite transport of mixed waste under alternative A - expected waste forecast.
Incident-Free Radiological Impacts
For the expected waste forecast, there would be increases in
dose to all onsite receptors and in the associated number of excess fatal
cancers compared to the no-action alternative (Table 4-24) due to the
increased volume of mixed waste. Additionally,
involved workers' exposures would increase due to their exposure to the
increased volume of low-level equipment shipped.
Transportation Accident Impacts
Refer to Sections 4.1.11.2.2 and 4.1.11.2.3 for radiological
and nonradiological accident impacts, respectively. The probability of an
onsite accident involving low-level or mixed wastes
would increase or decrease compared to the no-action alternative depending on
the volumes of wastes being shipped; however, the consequences due to a
particular accident would be the same as described in Section 4.1.11.2.2.
Accident probabilities for onsite shipments remain the same under all
alternatives and are summarized in Table 4-26. Impacts of accidents
involving offsite shipments were calculated as described in Section 4.1.11.2.2.
The results are summarized in Table 4-27.
Table 4-26. Annual accident probabilities for onsite shipments for all alternatives and waste forecasts.a
Table 4-27. Annual accident probability, doses associated with an accident, and excess latent cancer fatalities from an accident during offsite transport of mixed waste under alternative A.
The consequences and associated excess latent cancer
fatalities from offsite
shipments of mixed waste under this alternative
(Table 4-27) would be similar to the consequences to uninvolved workers under
the no-action alternative (Table 4-8). However, because of the small volume of
waste shipped offsite, a high consequence offsite accident would have less
severe impacts than an onsite shipment.

4.2.11.2.2 Transportation - Minimum Waste Forecast
Incident-Free Radiological Impacts
For the minimum waste forecast, there would be decreases in
dose (Table 4-28) to all onsite receptors compared to those from the expected
waste forecast due to the smaller volumes of all wastes shipped onsite.
Table 4-28. Annual dose (percent change from the expected waste forecast) and associated excess latent cancer fatalities from incident-free onsite transport of radioactive material for alternative A -minimum waste forecast.
For the minimum waste forecast, impacts from incident-free
offsite transportation of radioactive materials (Table 4-29) would be very
small.
Table 4-29. Annual dose and excess latent cancer fatalities from incident-free offsite transport of mixed waste for alternative A - minimum waste forecast.
Transportation Accident Impacts
The probability of an onsite accident involving radioactive
wastes would decrease slightly for the minimum waste forecast(Table
4-26) because less waste would be shipped compared to the expected wasteforecast;
however, the consequences due to an accident would be the same as described in
Section 4.1.11.2.2.
Effects of offsite accidents would
be the same as for the expected waste forecast; however, the probability of an
offsite accident would decrease by about one-third compared to the expected
waste forecast because of the smaller volumes of wastes shipped (Table
4-27).

4.2.11.2.3 Transportation - Maximum Waste Forecast
Incident-Free Radiological Impacts
For the maximum waste forecast, there would be large
increases in dose to all receptors (Table 4-30) due to the increases in
volumes of all wastes shipped. Impacts from incident-free offsite
transportation of mixed waste (Table 4-31) would be
very small.
Table 4-30. Annual dose (percent change from the expected waste forecast) and associated excess latent cancer fatalities from incident-free onsite transport of radioactive material for alternative A - maximum waste forecast.
Table 4-31. Annual dose and excess latent cancer fatalities from incident-free offsite transport of mixed waste for alternative A - maximum waste forecast.
Transportation Accident Impacts
The probability of an onsite accident involving radioactive
wastes would increase for the maximum waste forecast (Table 4-26)because
more waste would be shipped compared to the expected waste forecast; however,
the consequences due to an accident would be the same as described in Section
4.1.11.2.2. Effects of offsite accidents would be the
same as for the expected waste; however, the probability of an offsite accident
would be three times greater than that in the expected waste forecastbecause
of the larger volumes of wastes shipped (Table 4-27).
4.2.12 OCCUPATIONAL AND PUBLIC HeaLTH
Radiological and nonradiological impacts to workers and the
public are presented in this section for the three waste forecasts. As
expected, the impacts are smallest for the minimum waste forecast and
largest for the maximum waste forecast.
Under this alternative, the Consolidated Incineration
Facility, the transuranic waste characterization/
certification facility, the mixed waste
containment building, compaction facilities, and the
mobile soil sort facility would operate. These
facilities and changes in waste management would result in an increase in
adverse health effects over the no-action alternative for the three waste
forecasts. However, the effects would be small overall, except to involved
workers under the maximum waste forecast.
The waste management operations that produce most of the
occupational and public health effects are as
follows:
For radiological assessments, the same general methodology
was used as under the no-action alternative (see Section 4.1.12). The same risk
estimators were used to convert doses to fatal cancers, and wastes were
classified into treatability groups to facilitate the evaluations. However, the
development of radiological source terms and worker exposures was much more
involved. The releases of radioactivity to the environment and the radiation
exposures of workers were determined
for each waste forecast. The expected performance of new facilities was based
on actual design information, augmented as necessary by operating experience
with similar facilities.
Radiological impacts of facility operations were estimated for the 30-year period of analysis based on total material throughput. Annual impacts to workers and the offsite population were estimated by dividing the total 30-year impact by 30.

4.2.12.1 Occupational and Public Health - Expected Waste Forecast
For alternative A - expected waste forecast, the
volumes of wastes to be treated would be the same as under the no-action
alternative.
4.2.12.1.1 Occupational Health and Safety
Radiological Impacts
Table 4-32 presents the worker doses and resulting health
effects associated with the expected waste
forecast. Doses would remain well within the SRS administrative guideline of
0.8 rem per year. The probabilities and projected numbers of fatal cancers from
30 years of waste management operations under this alternative would be much
lower than those expected from all causes during the workers' lifetimes. It is
expected that there could be 0.86 additional fatal cancer in the workforce of
2,123. In comparison, the lifetime fatal cancer risk from all causes is 23.5 percent (refer to Section 4.1.12.1), which
translates to a 1 in 4 chance of any individual (including a worker) contracting
a fatal cancer, or 499 fatal cancers in the workforce of 2,123.
Nonradiological Impacts
DOE considered potential nonradiological impacts to SRS workers from air emissions from the following facilities: the Defense Waste Processing Facility, including In-Tank Precipitation; the MArea Vendor Treatment Facility; the Consolidated Incineration Facility; Building 645-N, hazardous waste storage; Building 645-2N, mixed waste storage; the mobile soil sort facility; four new solvent tanks; the transuranic waste characterization/certification facility; and the mixed waste containment building. Occupational health impacts to employees at the Defense Waste Processing Facility and In-Tank Precipitation were discussed in the Final Supplemental Environmental Impact Statement Defense Waste Processing Facility. Occupational health impacts to employees associated with the Consolidated
Incineration Facility were discussed in the Environmental
Assessment, Consolidated Incineration Facility (DOE 1992).
Table E.22 in Appendix E presents a comparison between
Occupational Safety and Health Administration permissible exposure limit values
and potential exposures to uninvolved workers at both 100 meters (328 feet)
and 640 meters (2,100 feet) from each facility for the expected, minimum,
and maximum waste forecasts. Downwind concentrations were calculated using
EPA's TSCREEN model (EPA 1988). For each facility's emissions, based on the
expected waste forecast, uninvolved workers occupational exposure would be less
than Occupational Safety and Health Administration permissible exposure limits.
In most instances, downwind concentrations would be less than 1 microgram
per cubic meter, whereas the Occupational Safety and Health Administration
limits are greater than 2,000 micrograms per cubic meter.
4.2.12.1.2 Public Health and Safety
Radiological Impacts
Table 4-33 presents the radiological doses to the public and
the resulting health effects associated with
the expected waste forecast. The annual doses to the offsite maximally exposed
individual (0.012 millirem) and to the regional population
(0.57 person-rem) surrounding SRS are small fractions of the doses that resulted
from SRS operations in 1993, which were well within regulatory limits (Arnett,
Karapatakis, and Mamatey 1994). For the offsite facility (assumed to be located
in Oak Ridge, Tennessee, for the purposes of this assessment) under this
forecast, the annual doses to the offsite maximally exposed individual (5.110-7
millirem) and to the regional population (2.310-7 person-rem) surrounding Oak
Ridge, Tennessee, represent a very small fraction (less than 0.01 percent) of
the comparable doses to the SRS regional population. These doses remain less
than 0.01 percent of the comparable SRS doses for all waste forecasts under this
alternative (see Appendix E for facility-specific data). For this waste
forecast, radiologically induced health effects to the public would be very
small (Table 4-33).
Nonradiological Impacts
Potential nonradiological impacts to individuals residing
offsite were considered for both criteria and carcinogenic pollutants. Maximum
SRS boundary-line concentrations for criteria pollutants are discussed in
Section 4.2.5.1.2.
For routine releases from operating facilities under the
expected waste forecast, criteria pollutant concentrations would be within state
and federal ambient air quality standards, as
discussed in Section 4.2.5.1.2, and health impacts to the public would be
very small.
Offsite risks due to carcinogens were calculated using the
Industrial Source Complex 2 model (Stewart 1994) for the same facilities listed
in Section 4.2.12.1.1. Emissions of carcinogenic compounds were based on the
types and quantities of waste being processed at each facility. Table 4-34
shows the excess individual lifetime cancer risks
calculated from unit risk factors (see Section 4.1.12.2.2) derived from EPA's
Integrated Risk Information System database (EPA 1994). As shown in
Table 4-34, the estimated incremental lifetime cancer risk associated with
routine emissions under the expected waste forecast is 2 in ten million. This
is the same as that for the no-action alternative and represents a small overall
increase in risk.
4.2.12.1.3 Environmental Justice Assessment
Section 4.1.12.2.3 described DOE's methodology for analyzing
radiological dose to determine if there might be adverse and disproportionate
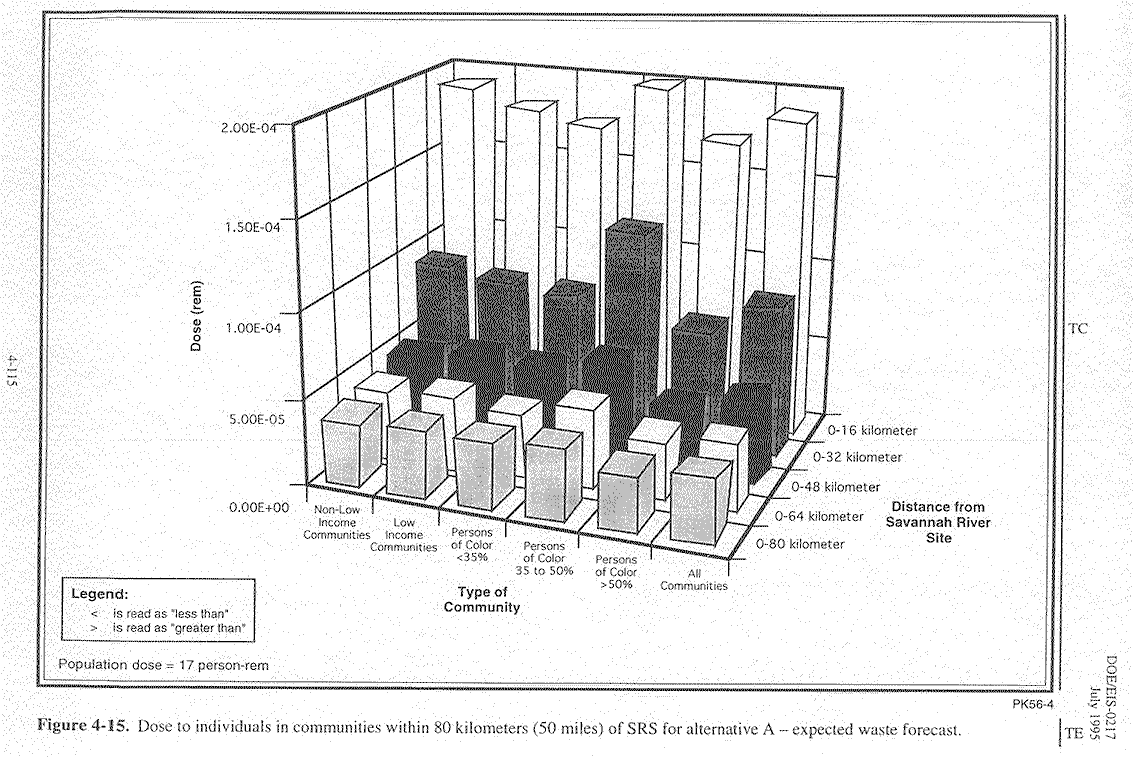
impacts on people of color low income. Figure 4-15 illustrates the results of
the analysis for alternative A - expected waste forecast for the 80-kilometer
(50-mile) region of interest in this eis. Supporting data for the analysis can
be found in Appendix E.
The predicted per capita dose differs very little between types of communities at a given distance from SRS, and the per capita dose is extremely small in each type of community. This analysis indicates that people of color or with low incomes in the 80-kilometer (50-mile) region would be neither disproportionately nor adversely affected.

4.2.12.2 Occupational and Public Health - Minimum Waste Forecast
Because the waste amounts for alternative A - minimum
waste forecast would be smaller than for the expected waste forecast and the
treatment operations would be the same, the impacts to workers and the public
would be smaller than described for the expected waste forecast.
Figure 4-15. Dose to individuals in communities within 80 kilometers (50 miles) of SRS under the alternative A expected waste forecast.
4.2.12.2.1 Occupational Health and Safety
Radiological Impacts
Table 4-32 includes the worker doses and resulting health
effects associated with the minimum waste
forecast. Doses and health effects associated with this case would be smaller
than those associated with the expected waste forecast.
Nonradiological Impacts
Table E.2-2 in Appendix E presents a comparison of the
nonradiological air concentrations to SRS workers for the minimum waste forecast
to permissible exposure limits under the Occupational Safety and Health
Administration. Exposures to SRS workers are either equal to or less than those
that would occur in the expected waste forecast. For each facility, employee
occupational exposure would be less than Occupational Safety and Health
Administration permissible exposure limits.
4.2.12.2.2 Public Health and Safety
Radiological Impacts
Table 4-33 includes the doses to the public and the
resulting health effects associated with the
minimum waste forecast. Doses and health effects associated with this case
would be smaller than those associated with the expected waste forecast.
Nonradiological Impacts
Potential nonradiological impacts to individuals residing
offsite are considered for both criteria and carcinogenic pollutants under the
minimum waste forecast. For routine releases from operating facilities,
criteria pollutant concentrations would be within state and Federal ambient air
quality standards, as discussed in Section 4.2.5.2.
Offsite risks due to carcinogens are presented in Table
4-34. The overall incremental lifetime cancer risk is approximately 1.9 in ten million. This latent cancer risk is
slightly less than that expected from the no-action alternative. DOE expects
very small health impacts to the public from emissions from facilities under
alternative A minimum waste forecast.
4.2.12.2.3 Environmental Justice Assessment
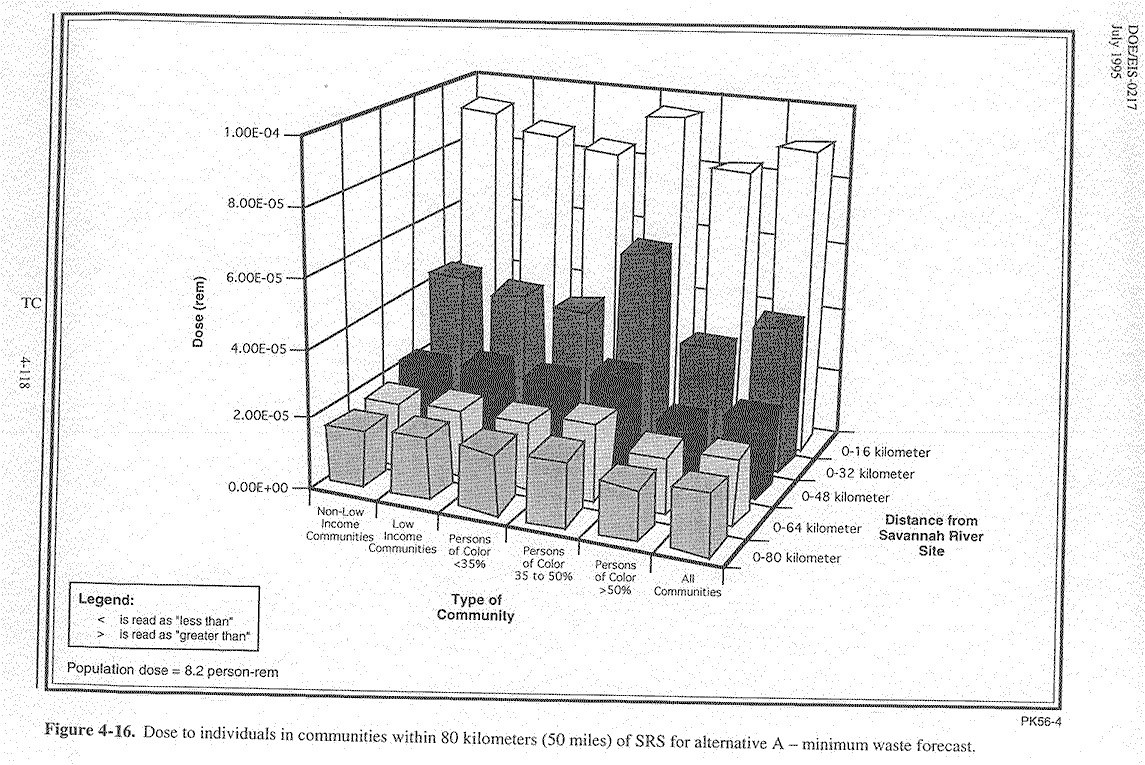
Figure 4-16 illustrates the results of the analysis for
alternative A - minimum waste forecast for the 80kilometer (50-mile)
region of interest in this eis. Supporting data for the analysis can be found
in the environmental justice section of Appendix E.
No community within 80 kilometers (50 miles) would be
disproportionately affected by emissions under this case.

4.2.12.3 Occupational and Public Health - Maximum Waste Forecast
The volumes of wastes to be treated for alternative A -
maximum waste forecast would be larger than for the minimum and expected waste
forecasts, but the treatment operations would be the same. Therefore, the
maximum waste forecast would result in the greatest health impacts to workers
and the public for this alternative.
4.2.12.3.1 Occupational Health and Safety
Radiological Impacts
Table 4-32 includes the worker doses and resulting health effects associated with the maximum waste forecast. The doses would remain well within the SRS administrative guideline of 0.8 rem per year. However, it is projected that less than 2 people in the involved workforce of 2,379 could develop a fatal
cancer sometime during their lifetimes as the result of exposure to radiation during the 30-year period of analysis.
Nonradiological Impacts
DOE assessed concentrations for exposure to SRS workers. Table E.2-2 in Appendix E presents a comparison between the nonradiological air concentrations SRS workers would be exposed to for the maximum waste forecast with Occupational Safety and Health Administration permissible exposure limits values. Exposures to SRS workers are either equal to or greater than those occurring in the expected waste forecast. However, for all facilities, employee occupational exposure would be less than Occupational Safety and Health Administration permissible exposure limits.
Figure 4-16. Dose to individuals in communities within 80 kilometers (50 miles) of the SRS under the minimum waste forecast.
4.2.12.3.2 Public Health and Safety
Radiological Impacts
Table 4-33 includes the doses and resulting health effects to the public associated with the maximum waste
forecast. The annual doses to the offsite maximally exposed individual (0.08 millirem)
and to the SRS regional population (3.4 person-rem)
would be about onethird of the doses that resulted from SRS operations in
1993, which were well within regulatory limits (Arnett, Karapatakis, and Mamatey
1994). For alternative A - maximum waste forecast, radiologically induced
health effects to the public would be very small.
Nonradiological Impacts
Potential nonradiological impacts to individuals residing
offsite are considered for both criteria and carcinogenic pollutants under the
maximum waste forecast. For routine releases from operating facilities,
criteria pollutant concentrations would be within state and Federal ambient air
quality standards, as discussed in Section 4.2.5.3.
During periods of construction, the criteria pollutant concentrations at the
SRS boundary would not exceed air quality standards under normal operating
conditions. With good construction management practices, such as wetting dirt
roads twice a day, particulate concentrations would be approximately 50 percent
of those shown in Section 4.2.5.3.
Table 4-34 presents offsite risks from carcinogens. The
overall incremental lifetime cancer risk is
approximately 2 in 10 million. This latent cancer risk is the same as expected
under the no-action alternative. DOE expects very small health impacts to the
public from emissions from facilities in the maximum waste forecast.
4.2.12.3.3 Environmental Justice Assessment
No community within 80 kilometers (50 miles) would
be disproportionately affected by emissions under this scenario (Figure 4-17).
4.2.13 FACILITY ACCIDENTS
This section summarizes the risks to workers and members of
the public from potential facility accidents associated
with the various amounts of wastes that might be managed under alternative A.
The methodologies used to develop the radiological and hazardous
material accident scenarios are the same as those discussed in Section 4.1.13.1
under the no-action alternative.
Figure 4-17. Dose to individuals in communities within 80 kilometers (50 miles) of the SRS under the maximum waste forecast.
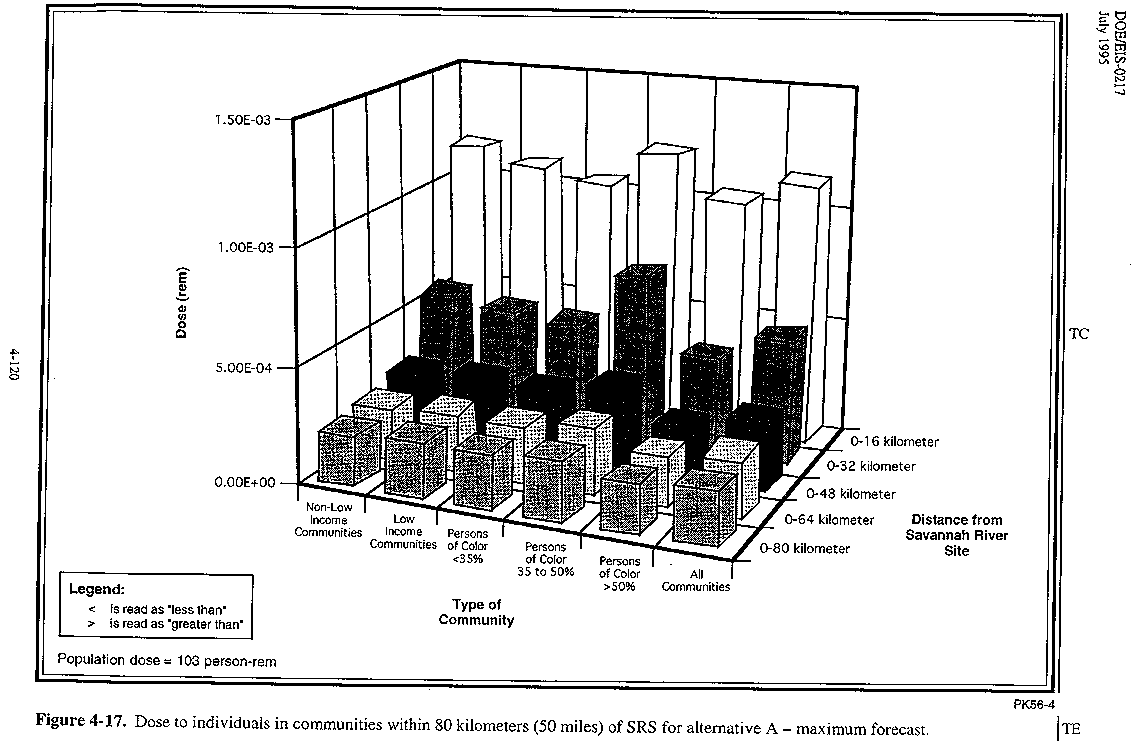

4.2.13.1 Facility Accidents- Expected Waste Forecast
Figures 4-18 through 4-21 summarize the estimated increases
in latent fatal cancers from radiological accidents
involving the various waste types on the population,
offsite maximally exposed individual, and uninvolved workers at 640 meters
(2,100 feet) and 100 meters (328 feet) for alternative A expected waste
forecast. Analyses are based on dose from the estimated bounding accident. The
accident presenting the greatest overall risk to the population
within 80 kilometers (50 miles) of SRS under this case is an
anticipated accident (i.e., one occurring between once every 10 years and
once every 100 years) involving either mixed waste
or low-level waste, which would increase the risk to the population within 80 kilometers
(50 miles) by 1.7´10-2 latent fatal
cancer per year (Figure 4-18).
An anticipated accident involving either mixed waste or low-level waste would pose the greatest risk
to the offsite maximally exposed individual (Figure 4-19) and the
uninvolved worker at 640 meters
(2,100 feet) (Figure 4-20). The
anticipated accident scenario would increase the risk to the offsite maximally
exposed individual by 3.3´10-7latent fatal cancer
per year and to the uninvolved worker at 640 meters (2,100 feet) by 1.8´10-5 latent fatal cancer per year.
An anticipated accident involving either mixed wastes or low-level wastes would also pose the greatest risk
to the uninvolved worker at 100 meters (328 feet) (Figure 4-21). The
anticipated accident scenario would increase the risk to the uninvolved worker
at 100 meters (328 feet) by 1.0´10-3latent fatal cancer
per year.
For each receptor group, regardless of waste type, the greatest estimated risks associated with alternative A are identical to the no-action alternative. However, there could be differences in the overall risk to each receptor group for specific waste types. For example, the overall risks for transuranic waste increase approximately 100 times between the no-action alternative and alternative A. Table 4-35 provides a comparison of overall risk for specific waste types between the no-action alternative and alternative A. A multiplicative change factor is used to illustrate differences between no-action and alternative A risks. If the risks presented are identical, the multiplication factor is one. However, if the
Figure 4-18. Summary of radiological accident impacts to the population within 80 kilometers (50 miles) for alternative A expected waste forecast.
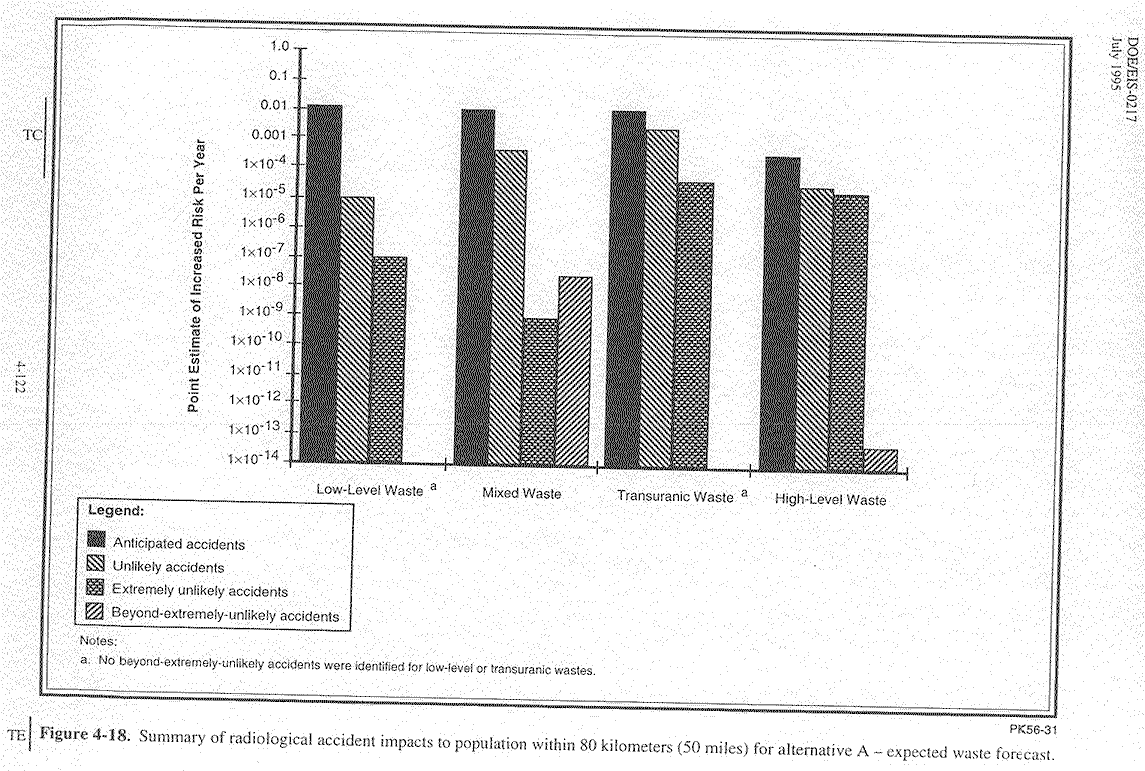
Figure 4-19. Summary of radiological accident impacts to the offsite maximally exposed individual from alternative A expected waste forecast.
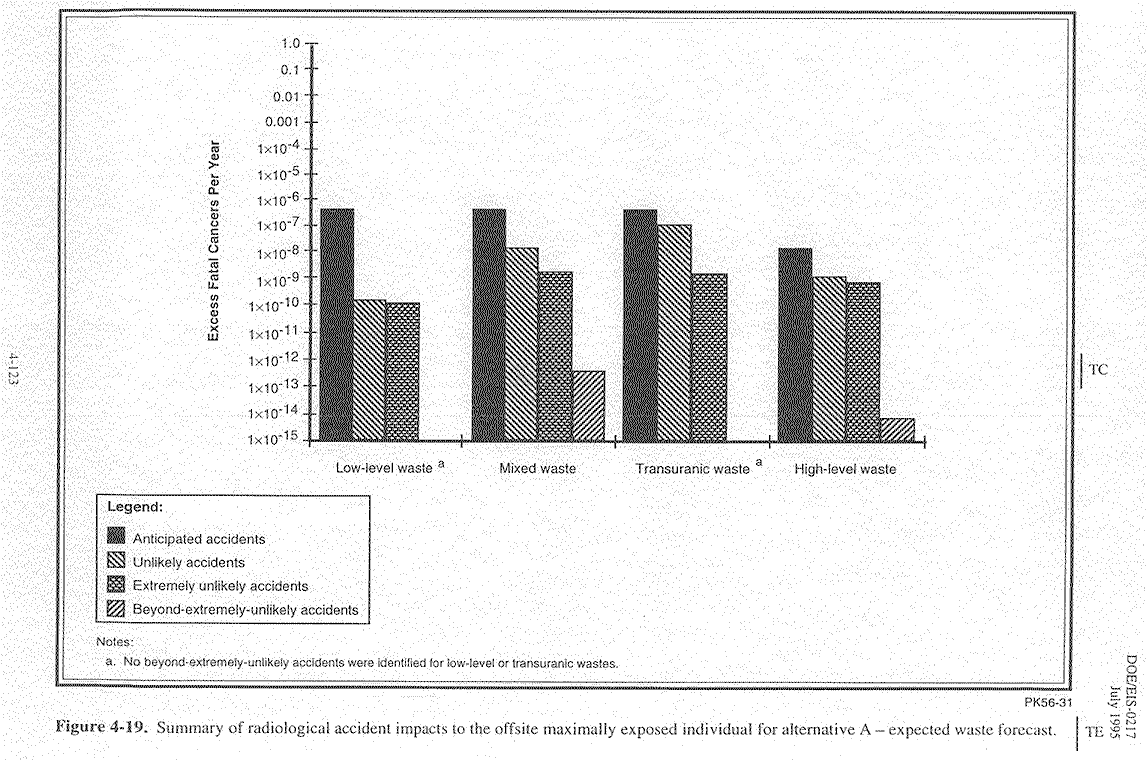
Figure 4-20. Summary of radiological accident impacts to the uninvolved worker within 640 meters (2,100 feet) from alternative A expected waste forecast.
Figure 4-21. Summary of radiological accident impacts to the population within 80 kilometers (50 miles) from the alternative A expected waste forecast risks presented are different, the multiplication factor is the ratio of the two values (i.e., higher estimated risk divided by smaller estimated risk). Arrows indicate the alternative A risks that are larger than the no-action risks.
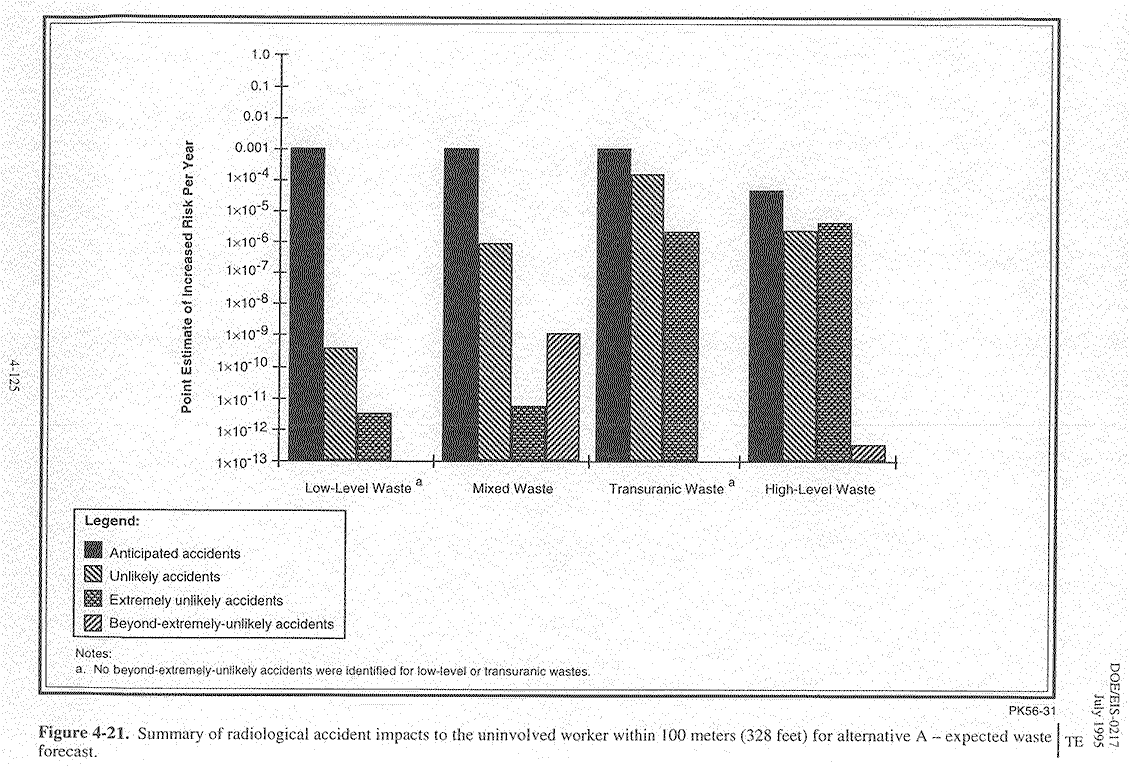
Table 4-35. Comparison of risks from accidents under the no-action alternative and alternative A.
A complete summary of all representative bounding accidents
considered for alternative A is presented in Table 4-36. This table provides
accident descriptions, annual frequency of occurrence, increased risk
of latent fatal cancers for all receptor groups, and the waste type associated
with the accident scenario. Details regarding the individual postulated
accident scenarios associated with the various waste types are provided in
Appendix F.
Table 4-37 presents for each waste considered a summary of the chemical hazards estimated to exceed ERPG-2 values for the uninvolved worker at 100 meters (328 feet). For this worker, seven chemical release scenarios would exceed ERPG-3 values. Moreover, another five chemical release scenarios would have estimated airborne concentrations that exceed ERPG-2 values where equivalent ERPG-3 values were not identified. For the offsite maximally exposed individual, no chemical release scenario
Table 4-37. Summary of chemical hazards associated with alternative A estimated to exceed ERPG-2 values.
would have airborne concentrations that exceed ERPG-3 values. In fact, in only one instance would a chemical release scenario have an airborne concentration that exceeds an ERPG-2 value for the offsite maximally exposed individual (release of lead; see Table F25 in Appendix F). Appendix F provides further detail and discussion regarding chemical hazards associated with each waste type.
In addition to the risk to human health from
accidents, secondary impacts from postulated accidents
on plant and animal resources, water resources, the economy, national defense,
contamination, threatened and endangered species, land use, and Native
American treaty rights are considered. This qualitative
assessment (see Appendix F) determined that no substantial
impacts would result from accidents for alternative A - expected waste
forecast.

4.2.13.2 Facility Accidents- Minimum Waste Forecast
DOE assumes that conclusions regarding representative
bounding accident scenarios could change with the amount of waste generated.
Since accident analyses in this eis are based on a conservative assumption of
peak utilization of facilities, the various waste forecasts would only affect
how long a facility (e.g., the Consolidated Incineration
Facility) would operate. Therefore,
while consequence or frequency for the postulated accidents
would not change, the time the risk from a facility-specific
accident would exist could be the same, more, or less, depending on the waste
forecast. Alternative A -minimum waste forecast would not be expected to
increase or decrease the duration of risk associated with the representative
bounding accidents (see Appendix F).
The size and number of new facilities needed to meet waste
management requirements would be affected by the amount of waste generated.
Thus, the consequences or frequencies for specific accident scenarios could
increase or decrease with the addition or subtraction of facilities, depending
on the waste forecast. DOE expects that a slight decrease in risk
would occur for alternative A - minimum waste forecast. A comparison of the
number and type of facilities needed for the minimum and expected waste
forecasts is provided in Section 2.4.7.
Transuranic waste provides the most
dramatic example of why the risk would increase or decrease. It
should be noted that the risk remains constant for an alternative and waste
forecast, regardless of the waste type evaluated. For example, while
alternative A - expected waste forecast calls for 12 transuranic waste storage pads, the minimum waste forecast estimates only 3 additional transuranic
waste storage pads. Since the number of drums would be reduced, a resultant
decrease in the overall risk is assumed between the two waste forecasts.

4.2.13.3 Facility Accidents- Maximum Waste Forecast
The maximum waste forecast would not be expected to increase
or decrease the duration of risk for the facilities associated
with the representative bounding accidents identified
under alternative A (see
Appendix F).
While the expected waste forecast calls for 12 transuranic waste storage pads, the maximum waste forecast estimates that 1,168 additional transuranic waste storage pads would be needed to store the maximum amount of waste SRS could receive. Since the number of drums would increase, an increase in risk over the expected waste forecast would occur.

|
NEWSLETTER
|
| Join the GlobalSecurity.org mailing list |
|
|
|