


I.6.0 SOCIOECONOMICS
The socioeconomic analysis focuses on Benton and Franklin counties in Washington State. These counties make up the Richland-Kennewick-Pasco Metropolitan Statistical Area (MSA), also known as the Tri-Cities MSA. Other jurisdictions in Benton County include Benton City, Prosser, and West Richland. Connell is the largest city in Franklin County after Pasco. A number of neighboring counties: Yakima, Walla Walla, Adams, and Grant counties in Washington; and Umatilla and Morrow counties in Oregon are impacted by activities at the Hanford Site. However, because nearly 90 percent of Hanford Site employees live in Benton and Franklin counties, the Site's impacts on these other counties are very small (Serot 1995). Thus, no discussion of baseline conditions in the neighboring counties is provided.
In accordance with Federal environmental justice policy, a discussion is provided in Sections I.6.1.4 and I.6.1.5 concerning the distribution and size of minority and Native American and low-income populations within an 80-km (50-mi) radius of the Hanford Site (Executive Order [EO] 12898). This discussion provides the basis for the required identification of potential disproportionate and adverse environmental impacts of EIS alternatives on minority and Native American populations and low-income populations. The 80-km (50-mi) radius includes counties not otherwise covered in this socioeconomic section because overall Site socioeconomic impacts on these counties are very small. However, this section does identify the minority and Native American population and employment within the Hanford Site's primary zone of socioeconomic influence, the Tri-Cities MSA (Benton and Franklin counties).
Before World War II, the economy in the Tri-Cities MSA was based primarily on agriculture. Since World War II, the Hanford Site has been the largest factor in the local economy. Plutonium production and processing was the primary mission of the Site until 1988 when the Site's mission became waste management and environmental restoration. Basic and applied research became an important secondary mission continuing to present.
Changes in the Hanford Site's mission and the cancellation of a Washington Public Power Supply System project at Hanford in the early 1980's (after only one of three planned nuclear power plants was completed) have had a large impact on the economy of the Tri-Cities MSA, creating boom-bust cycles that have had ramifications for employment, population, housing, and infrastructure. Table I.6.0.1 details Hanford Site employment, Washington Public Power Supply System employment, and total nonfarm employment for the Tri-Cities MSA, together with population in the MSA for 1980 to 1994. The Tri-Cities is currently in the early stages of an economic transition as employment at the Hanford Site declines from its recent peak levels.
I.6.1 DEMOGRAPHICS
This section examines population characteristics in the Tri-Cities MSA and the effects of the Hanford Site on the demographics of the area.
I.6.1.1 Population Trends
Population tended to follow changes in nonfarm employment in the Tri-Cities area during the 1980's and early 1990's (Table I.6.0.1). Between 1981 and 1984, nonfarm employment fell by approximately 11,000 jobs, while population fell by about 6,000. Employment began to increase after 1984 but population continued to fall, hitting a low of 138,300 in 1989. Employment increased until 1987 and then fell in 1988 after the decision to close the last plutonium production reactor (N Reactor). Between 1988 and 1989, however, employment in the Tri-Cities jumped by almost 2,000 (despite a continued decline in Hanford Site employment). When employment began to increase again at the Hanford Site in 1990, population increased by almost 12,000, effectively returning to the 1981 level.
The population trends reflected actual employment in the Tri-Cities MSA and expectations of employment. Once the economy began to grow in the late 1980's, people moved into the area, some because they had jobs but many others because they were searching for work. The population of the Tri-Cities area continued to grow as the Site and total nonfarm employment increased through 1994. Data for 1995 showed total Tri-Cities population continuing to grow, while Hanford Site employment declined and total area nonfarm employment remained virtually unchanged from 1994 (Table I.6.0.1) (Neitzel 1996).
Table I.6.0.1 Population and Employment in the Richland-Kennewick-Pasco MSA, 1980 to 1994
I.6.1.2 Population by Race and Minority Status
Table I.6.1.1 details the 1990 population for Benton and Franklin counties and for comparison provides Washington State population by race and minority status. The data show that minorities are a smaller percentage of Benton County population than in Franklin County or Washington State. The largest minority group in the Tri-Cities MSA is the Hispanic origin group, which makes up 30.2 percent of the population of Franklin County and 7.7 percent of Benton County. African Americans make up 1 percent of population in Benton County and 3.5 percent of Franklin County's population.
The American Indian, Eskimo, and Aleut category (Native Americans) accounts for less than 1 percent of the population in each county.
I.6.1.3 Urban, Rural, and Farm Populations
Benton County has a higher percentage of its population classified as urban (87.2 percent) than Washington State (76.4 percent) as a whole, while Franklin County has a lower percentage of urban residence (72.7 percent) than Washington State. At the same time, Benton County's farm population is more than twice as large as a percentage of total population than for Washington State as a whole (12.6 percent to 5.5 percent). Franklin County's farm population is almost five times as large on a percentage basis (24.9 percent) as Washington State's farm population. Franklin County's nonfarm rural population makes up 30 percent of the county's total population, which is virtually the same as the State's (29.3 percent), while more than twice the percentage in Benton County (13.0 percent). These data suggest the relative importance of farming in Franklin County and to a lesser extent in Benton County, compared to Washington State as a whole.
Table I.6.1.1 Population by Race and Minority Status, 1990
I.6.1.4 Minority and Native American Populations
This section and the following section on low-income populations (I.6.1.5) provide data on the distribution of minority, Native American, and low-income populations within an 80 km (50 mi) radius of the Hanford Site, in accordance with the Federal environmental justice policy (EO 12898).
The data provided are based on the following definitions:
- Minority and Native American population: Individuals identified in U.S. Bureau of the Census data for 1990 as Negro, Black or African American, Hispanic, Asian, and Pacific Islander, Native American, Eskimo, Aleut, and other non-White persons (DOC 1991). The minority population consists of the number of individuals residing in the 80-km (50-mi) radius of the Hanford Site who are members of a minority group.
- Low-Income population: Individuals identified in the U.S. Bureau of the Census data for 1990 as having incomes at or below 100 percent of the poverty level (DOC 1991). The low-income population consist of the number of individuals residing in the 80-km (50-mi) radius of the Hanford Site who have incomes below the poverty level.
- Minority and CTUIR, Yakama Indian Nation, and Nez Perce Tribes and low-income communities: For the purposes of this EIS, minority and Native American and low-income populations were analyzed at the census tract level. All tracts within a 80-km (50-mi) radius of the Hanford Site were included in the analysis. Tracts with a substantial minority or low income population were identified as a community for purposes of environmental justice analysis. The 80-km (50-mi) area of interest was selected based on guidance from DOE regarding the analysis of environmental justice in NEPA documents and is the same area used for the analysis of environmental and human health impacts in other sections of the EIS.
The first step in identifying minority and Native American and low-income communities was to identify the total population of each group within the 80-km (50-mi) radius area of interest. Native American populations of primary concern include members of the three affected Tribes: the Yakama Indian Nation, the CTUIR, and the Nez Perce Tribe. The second step was to identify the combination of census tracts for each type of community that had a total minority and Native American or low-income population that would total one-half of the total population for the entire area of interest.
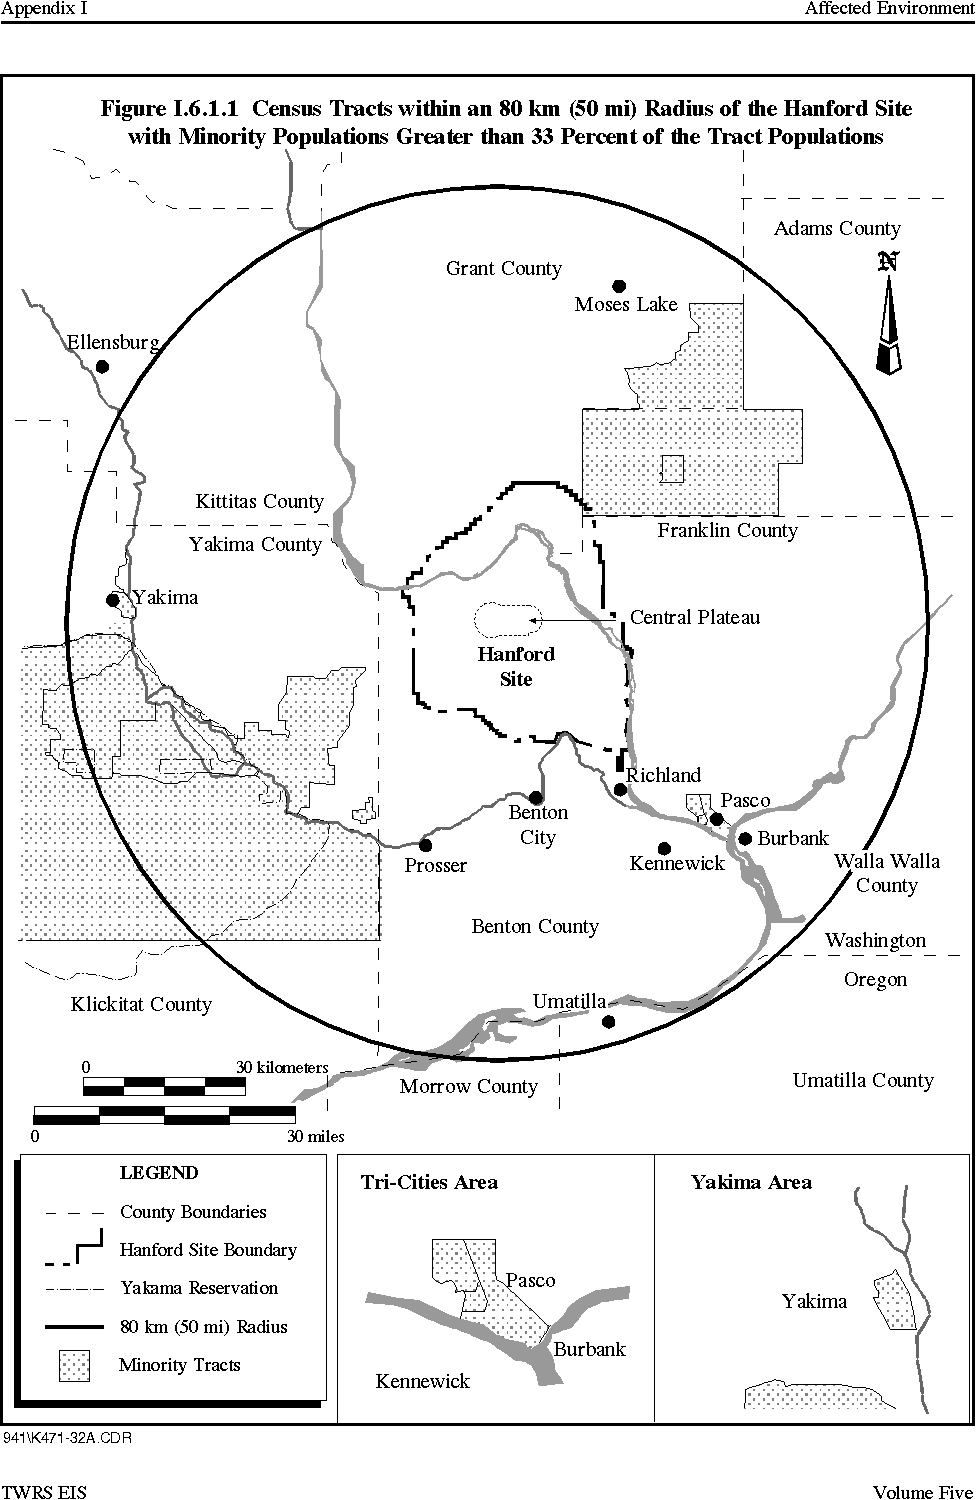
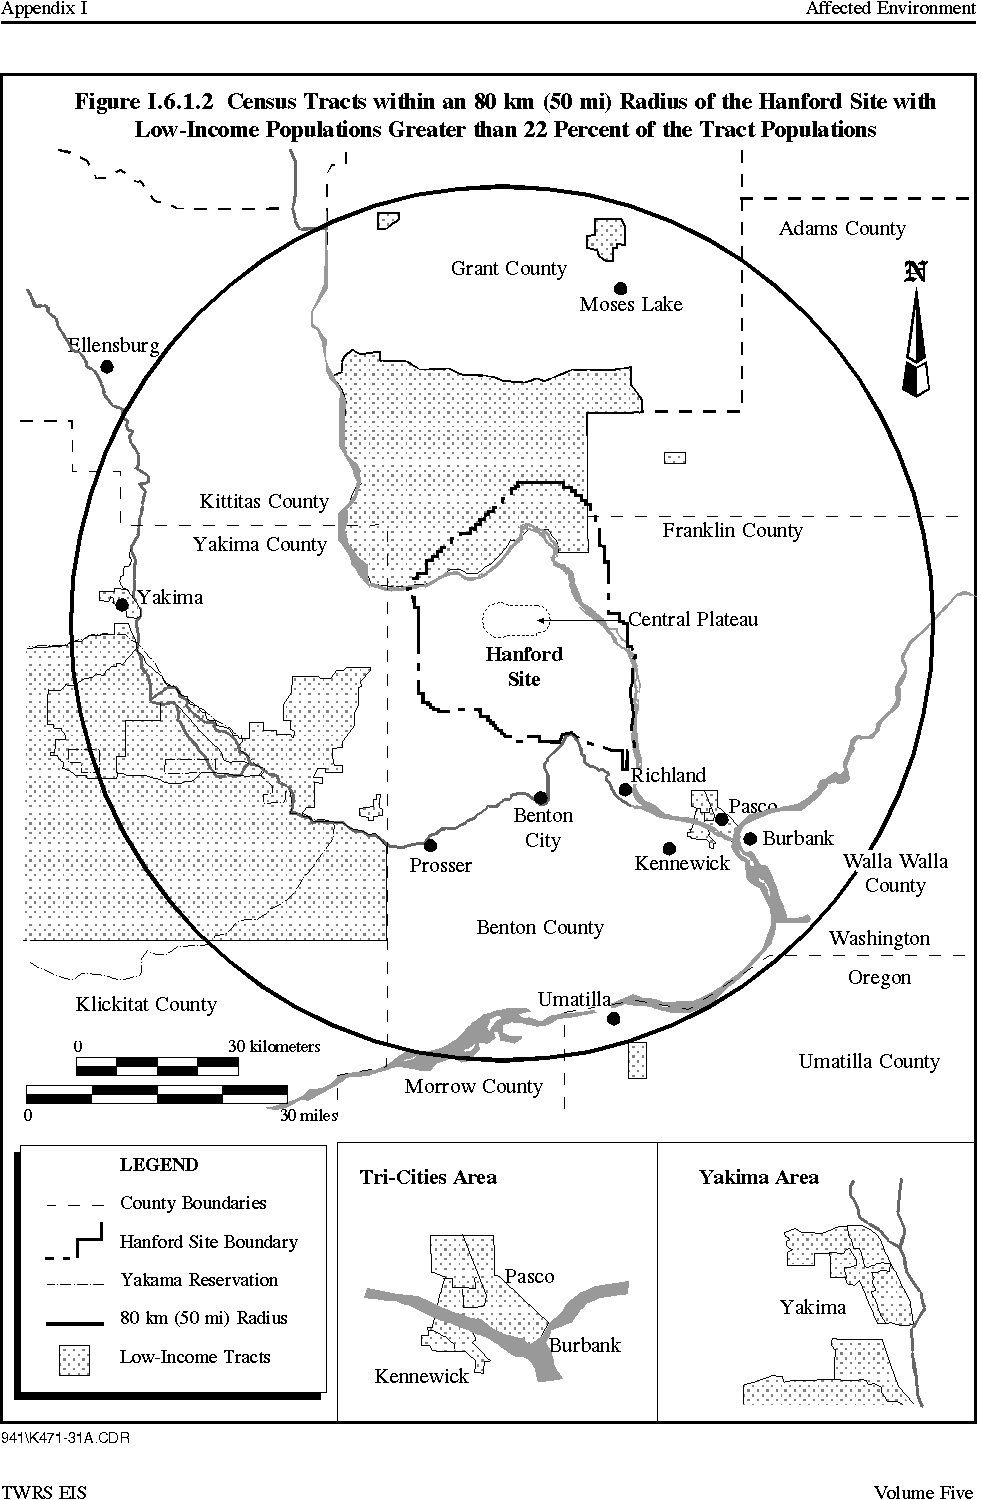
For minority populations, census tracts with populations that when combined, totaled one-half of the minority and Native American population for the area of interest, had an average percentage of minority and Native American individuals of 33 percent of the tract's total population. These census tracts were then considered minority and CTUIR, Yakama Indian Nation, and Nez Perce Tribes for the purpose of environmental justice analysis in the EIS (Figure I.6.1.1). For low-income populations, census tracts with populations that when combined totaled one-half of the low-income population for the area of interest had an average percentage of low-income individuals of 22 percent of the census tract's total population. These census tracts were then considered low-income communities for the purpose of the environment justice analysis in the EIS (Figure I.6.1.2).
The 80-km (50-mi) radius surrounding the Hanford Site's Central Plateau had a total minority and Native American population of 86,415 individuals as of the 1990 Census (Table I.6.1.2). The area's minority and Native American population of 19.3 percent greatly exceeds the Washington State average of 13.1 percent. The Hanford Site region's principal minority groups consist of Hispanics. In 1990, Hispanics comprised approximately 14.3 percent (64,300 individuals) of the area's population. The Hispanic population is relatively dispersed throughout the area, although Adams, Franklin, and Yakima counties in Washington State have relatively higher populations of Hispanic residents than do the other counties in the region. The Native American population of the surrounding area was approximately 2.4 percent (10,800 individuals). The Native American population is disproportionately located on the Yakama Indian Reservation in south-central Washington, with smaller concentrations in Benton and Grant counties in Washington. African American (5,200 or 1.2 percent) and Asian (6,100 or 1.4 percent) populations in 1990 within the surrounding area were very small and located predominantly in Yakima, Benton, and Franklin counties in Washington State.
As of the 1990 census, 17 of the 97 census tracts that are contained completely or partially within the 80-km (50-mi) radius of the Hanford Site had minority or Native American populations that exceeded 33 percent of their total tract populations (Table I.6.1.3).
These 17 census tracts contained less than one in five of the area's total residents, yet approximately 52 percent of the region's total minority or Native American population reside in these tracts. Moreover, in 1990 these 17 census tracts were home to over 6 in 10 of the area's Native American residents and at least 57 percent of the region's Hispanic population. Only 4 of the 10 counties in the area (Yakima, Franklin, Grant, and Adams) have census tracts with high levels of minority or Native American residents compared to the region as a whole. In 1990, Yakima County had 10 of the 17 tracts with a 33 percent or greater minority or Native American population. The highest percentage population of minority or Native American residents was found in census tract 0025, located in Yakima County (71.4 percent).
Geographically, the tracts with disproportionately high minority populations or Native American are located northeast of the Hanford Site in Adams and Grant counties, southeast of the Site in Franklin County, southwest and west of the Site along the Yakima River Valley in Yakima County, and on the Yakama Indian Reservation (Figure I.6.1.1). Of the remaining census tracts, 49 tracts had 1990 minority and Native American populations of less than 10 percent, 23 tracts had minority or Native American populations under 20 percent, and 9 tracts had minority and Native American populations of between 21 and 33 percent.
Five census tracts (Table I.6.1.4), all located within the Yakama Indian Reservation in Yakima County, Washington have large Native American populations. In 1990, the population of these tracts contained nearly 57 percent of the 80-km (50-mi) radius area's Native American population. As of 1990, these tracts were the only census tracts in the area where the Native American population exceeded 8 percent of the tract population.
Census data are an imprecise tool for determining the exact representation of the Hispanic population. Individuals of Hispanic origin derive from diverse cultures and ethnicities. Racial identification is complicated by the lack of a Hispanic category. Hence, Hispanics select from among the available choices of White, African American, American Indian, or Other. Many select Other, although up to 4 in 10 select a different designation, with the bulk selecting White. For the purposes of this report, the census data for the Other category is used to provide an indication of those census tracts that are disproportionately populated by residents of Hispanic origin. Although the Other category does tend to under report the Hispanic population, it provides a tool of sufficient accuracy to approximate Hispanic population concentrations.
All of the 17 census tracts with a minority and Native American population greater than 33 percent had substantial numbers of individuals listed in the Other category (Table I.6.1.5.). In all but three of the tracts, the Other category alone accounted for more than 33 percent of the population of the census tracts. Two of these three tracts are located on the Yakama Indian Reservation and have substantial Native American populations. The third tract is located in Franklin County.
I.6.1.5 Low-Income Populations
Figure I.6.1.2 shows the census tracts within an 80-km (50-mi) radius of the Hanford Site with low-income populations greater than 22 percent of the tract population. The 80-km (50-mi) radius surrounding the Hanford Site had a total low-income population in 1990 of 77,700 (Table I.6.1.6).
The area's low-income population of 17.3 percent greatly exceeded the Washington State average of 10.9 percent. In counties examined within Washington, only Walla Walla, Kittitas, and Benton counties had low-income populations below or slightly above the State-wide average.
All of the remaining counties had low-income populations exceeding the 17.3 percent region average. Franklin County, Washington had a low-income population more than double the State-wide average.
In all, 25 of the 97 census tracts that are contained all or in part within the 80-km (50-mi) radius of the Hanford Site had low-income populations in 1990 greater than 22 percent of their total populations (Table I.6.1.7). These 25 census tracts contained less than 3 in 10 of the area's total residents (27.9 percent), yet, more than half of the region's total low-income population lived in these tracts (50.8 percent). All but 4 of the counties, Walla Walla, Kittitas, and Klickitat in Washington, and Morrow County, Oregon, had at least 1 census tract containing at least 22 percent of the low-income population. Adams and Benton Counties in Washington, and Umatilla County, Oregon, had 2 or fewer census tracts with low-income populations greater than 22 percent.
Yakima County had 4 of the 5 tracts with 22 percent or greater low-income population in 1990. The highest percentage population of low-income residents was found in census tract 0001, located in Yakima County (45.4 percent). The 25 tracts had a total average low-income population of more than 31.5 percent. Geographically, the tracts with large, low-income populations (22 percent or greater) are located north and northeast of the Hanford Site in Grant County, southeast of the Site in Franklin County, and southwest and west of the Site along the Yakima River Valley and on the Yakama Indian Reservation in Yakima County (Figure I.6.1.2).
Of the remaining census tracts, 30 tracts had 1990 low-income populations that are less than the Washington State average (10.9 percent), 27 tracts had low-income populations between 11 percent and the average low-income population level of 17.3 percent of the 80-km (50-mi) area, and 15 tracts had low-income populations between 17.3 and 22 percent. Fourteen of the 30 census tracts with low-income populations under the Washington State average are located in Benton County (12 tracts) or in the two Franklin County tracts located closest to Hanford Site transportation access.
I.6.1.6 Household Income
The largest fraction of Franklin County households is in the $15,000 to $24,999 income range (Table I.6.1.8). Benton County has its highest concentration of households in the $35,000 to $49,999 range, as does Washington State as a whole. Benton County incomes are slightly skewed to the higher household income ranges as compared to incomes in Washington State as a whole, while Franklin County incomes are skewed to the lower income ranges. Median household income in Benton County was $41,800 in 1993 , while per capita income was $21,030 . Median household income in Franklin County was $30,525 in 1993 , while per capita income was $17,230 . In 1993 , Washington State median household income was $37,316 , while per capita income was $21,770 .
Table I.6.1.8 Household Income, 1990
Data on persons and families below the poverty level show that for most categories Benton County has the same or slightly higher poverty rates as Washington State (11.1 percent compared to 10.9 percent). In contrast, Franklin County's 23 percent poverty rate is substantially higher than the poverty rates for Washington State and Benton County (Table I.6.1.9). The data on income reflect overall the greater urbanization of Benton County and the effects of the Hanford Site as a large source of specialized technical and professional employment in Benton County.
Table I.6.1.9 Persons and Families Below Poverty Level, 1990
I.6.1.7 Educational Attainment
Benton County residents have approximately the same level of education as residents State-wide while Franklin County residents tend to have a lower level of educational attainment (Table I.6.1.10).
I.6.2 PUBLIC FACILITIES AND SERVICES
The following sections describe public facilities and service systems in the Tri-Cities that potentially could be impacted by implementation of the EIS alternatives. Discussions are provided for public safety, hospitals, electricity and natural gas, sewer, and solid waste. Water supply systems are discussed in Section I.2.3.
I.6.2.1 Public Safety
Public safety services, including police and fire, are provided by a number of jurisdictions in the region. Police protection is provided by the county sheriff departments of Benton and Franklin counties, local municipal police departments (Pasco, Richland, Kennewick, and West Richland ), and the Washington State Patrol Division in Kennewick. In terms of total staffing, the local municipal police departments ( 179 commissioned officers and 76 reserve officers) are considerably larger than the two county sheriff departments, which had 62 commissioned officers and 45 reserve officers in 1995 ( Neitzel 1996 ).
Fire protection in the Tri-Cities area is provided by fire departments in the cities of Kennewick, Pasco, and Richland, a volunteer fire department in West Richland, and three rural fire departments in Benton County.
Table I.6.1.10 Educational Attainment, 1990
Public safety services are also provided at the Hanford Site. In the past the Hanford Patrol has provided security and law enforcement services for the Site. Currently, the Benton County Sheriffs Department is providing law enforcement support. The Sheriffs Department maintains an office in the 300 Area. The Hanford Fire Department has approximately 155 firefighters who are trained to dispose of hazardous waste and fight chemical fires. The Hanford Fire Department has fire stations in the 100, 200, 300, 400, and 1100 Areas of the Hanford Site.
I.6.2.2 Hospitals
There are three large hospitals and four small emergency centers in the Tri-Cities area. Kadlec Medical Center in Richland has 133 beds, approximately 6,000 annual admissions, and operates at 50 percent capacity. Kennewick General Hospital has 70 beds, 4,800 annual admissions, and operates at approximately 44 percent capacity. Our Lady of Lourdes Hospital in Pasco had over 4,400 admissions in 1994 (Neitzel 1996) .
The Hanford Environmental Health Foundation primarily provides risk-management services for the Site; they also provide health screening for workers and respond to emergencies at the Site. The Hanford Environmental Health Foundation currently operates five onsite health service centers including facilities in the 100, 200 East, 200 West, and 300 Areas.
I.6.2.3 Schools
Educational services at the primary and secondary level are provided by four school districts. Kennewick is the largest district, serving approximately 13,000 students in 1994, with nearly 8,700 students in the Richland district, 7,800 students in the Pasco district, and 1,500 students in the Kiona-Benton district (Cushing 1995).
School enrollment has increased over the last few years, with all four school districts operating at or near their capacity during the 1994 school year (Cushing 1995). Despite declining Hanford Site employment, school enrollment in the 1995 school year increased by the following approximate amounts: Richland 0.9 percent; Pasco 1.1 percent; Kennewick 2.6 percent; and Kiona-Benton 5.1 percent (Brown 1995, Foley 1995, Haun 1995, Marsh 1995, Meilour 1995, O'Neil 1995). Portable classrooms are used in the Richland (20 portables) and Pasco (60 portables) school districts. In 1995, the Richland, Kennewick, and Kiona-Benton districts were operating at capacity, while the Pasco district was at capacity for the primary grades but had room for more students at the secondary level (Neitzel 1996).
Post-secondary education in the area is provided by the Columbia Basin Community College and the Tri-Cities branch campus of Washington State University. The fall 1995 enrollments for these schools were approximately 6,700 and 1,200 , respectively (Neitzel 1996) .
I.6.2.4 Electricity and Natural Gas
Electricity in the Tri-Cities is provided by the Benton County Public Utility District, Benton Rural Electrical Association, Franklin County Utility District, and the City of Richland Energy Services Department. The Bonneville Power Administration, a Federal power marketing agency, supplies all the power that these utilities provide in the local area.
Electrical power for the Hanford Site is purchased wholesale from the Bonneville Power Administration. The Hanford Site electrical distribution system is used to distribute power to the majority of the Site. The city of Richland distributes power to the 700, 1100, and 3000 Areas. This is approximately 2 percent of the total Hanford Site usage. Energy requirements for the Hanford Site exceeded 550 megawatts (MW) during fiscal year 1988 (Cushing 1994). The Site's electrical requirement in 1993 was substantially lower at approximately 57 MW (Cushing 1994).
Natural gas, provided by the Cascade Natural Gas Corporation, serves a small portion of the regions residents. In December 1993, Cascade Natural Gas Corporation had approximately 5,800 residential customers (Cushing 1994).
Hydroelectric, coal, nuclear power, oil, and natural gas fuel the Pacific Northwest's electrical generation system. Hydroelectricity is the primary power source in the region, accounting for approximately 74 percent of the regions installed generating capacity of 40,270 MW, and supplying approximately 56 percent of the electricity used by the region. Coal provides 16 percent of the region's electrical generating capacity (Cushing 1994). The one operating commercial nuclear power plant in the Pacific Northwest (located on the Hanford Site) provides approximately 6 percent of the regions generating capacity.
Throughout the 1980's, the Pacific Northwest had more electric power than it required. However, this surplus has been exhausted and the regional system generates only enough power to meet regional electrical needs. It is estimated that the Pacific Northwest will need an additional 2,000 MW over 1991 consumption by the turn of the century (Neitzel 1996).
I.6.2.5 Sewer
Sanitary waste in the 200 Areas is currently disposed of through septic tanks and drain fields. There are concerns about the ability of the current system to handle projected sanitary waste disposal needs resulting from new facilities, increased personnel, and changing environmental regulations. The planned construction of a central collection and treatment facility in the 200 Areas was canceled due to funding constraints. Future upgrades to 200 Areas septic systems may be needed to meet capacity and regulatory requirements (Harvey 1995).
The major incorporated areas of Benton and Franklin counties are served by municipal wastewater treatment systems and the unincorporated areas are served by onsite septic systems. The city of Richland's wastewater treatment system is designed to treat a total capacity of 1.1E+08 L (30E+07 gal/day). The Richland system processed an average of 7.6 E+07 L/day ( 2.0E+07 gal/day) in 1994 ( Nietzel 1996 ). The wastewater treatment system for the city of Kennewick is also operating well below capacity. The Kennewick system has a treatment capacity of 8.3E+07 L/day (2.2E+07 gal/day) . In 1994 the Kennewick system processed an average of 3.8 E+07 L/day (1.0E+07 gal/day ). The Pasco wastewater treatment system has the capacity to treat 9.5E+07 L/day ( 2.5E+07 gal/day) , and currently processes an average of 2. 9 E+07 L/day (7.8E+06 gal/day ) ( Neitzel 1996 ).
I.6.2.6 Solid Waste
The existing Hanford Site nonradioactive solid waste landfill is expected to reach its capacity in 1996. In October 1995 it was announced that DOE and the city of Richland reached an agreement to send the Site's nonregulated and nonradioactive solid waste to the Richland Sanitary Landfill (DOE 1995k).
The city-operated Richland Sanitary Landfill serves Benton County. The landfill, which receives about 200 tons of solid waste per day, has a current life expectancy of 50 years (Penour 1994). This could be extended to approximately 100 years with design modifications.
The city of Kennewick has a contract with Waste Management of Kennewick for solid waste disposal. Waste Management disposes of the solid waste at the Columbia Ridge Landfill in Arlington, Oregon, a facility with a life expectancy of approximately 50 years (Denley 1994).
The cities of Pasco and West Richland have contracts with Basin Disposal, Inc. for solid waste disposal. Basin Disposal, Inc. disposes of the solid waste at the Roosevelt Regional Landfill in Roosevelt, Washington, a facility with a life expectancy of approximately 40 years (Thiele 1995).
I.6.3 ECONOMY
The Hanford Site is the largest employer in the Tri-Cities area. This is a key factor in the local economy. In 1995 , total nonfarm employment in the area averaged about 72,200 . During the same period, Hanford Site employment was about 15,800 or nearly 22 percent of total nonfarm employment. In addition, other workers who are not included in the data as Hanford Site employees provide goods and services to the Hanford Site or its contractors. Agriculture, food processing, retail trade, and other industries provide substantial economic diversity to the Tri-Cities MSA.
Farm employment averaged about 3,500 jobs in Franklin County in 1992 and 4,200 jobs in Benton County. However, Franklin County farm employment ranged from a high of about 9,000 in June 1992 to a low of 1,100 in January. The range in Benton County was 10,700 in June to 1,900 in December. This range reflects the seasonal nature of farm labor. In addition, many farm workers are migratory workers who come to the area during harvest seasons then move on to other regions. Also, year-to-year changes in farm employment are subject to random variations in weather and agricultural market conditions. Changes in Hanford Site employment do not impact the area's farm employment, and for this reason the following discussion focuses on nonfarm employment only.
I.6.3.1 Industries and Employment
Besides DOE and the Hanford Site contractors, major employers in the Tri-Cities MSA include Siemens Nuclear Power Corporation, Sandvik Special Metals, Burlington Northern Railroad, and the Washington Public Power Supply System. Two other major employers, Iowa Beef Processors and Boise-Cascade, have facilities in Walla Walla County adjacent to Franklin County with many of their employees living and shopping in the Tri-Cities (Cushing 1994).
Table I.6.3.1 shows average annual employment by sector in 1993 and 1995 . Total nonfarm employment was approximately 72,200 in 1995, compared to 72,300 in 1994. The largest sector is services, which includes business services, research services (including most Hanford Site employees), and other services. Other Hanford Site employees are classified in the construction, health services, and business services sectors.
After services, the next largest sector is wholesale and retail trade. The Tri-Cities MSA is the main retailing sector for southeastern Washington State and northeastern Oregon. A number of national retail chains have opened outlets in the MSA in the last few years. Columbia Center in Kennewick is the primary regional shopping mall (Serot 1993).
Government is the third largest sector, including Federal, State, and local governments and public schools. Construction has been a key sector in the past few years because of new housing construction, commercial construction, and construction at the Hanford Site. Food processing is the largest manufacturing industry, followed by chemicals. The services sector in Benton County, which includes most Hanford Site and Hanford-related employment, dominates the economy in the Tri-Cities MSA. The services sector in Benton County accounted for $769 million in wages, or about 43 percent of wages paid in the two counties (Table I.6.3.2). State-wide, services accounted for only 21 percent of wages paid. The average wage in the services sector in Benton County was more than $34,000, compared to $17,000 in Franklin County and $23,000 statewide. The higher wage in the services sector in Benton County reflects the specialized technical and professional work force at the Hanford Site.
Table I.6.3.1 Average Annual Employment by Sector Tri-Cities Area, 1993 and 1995
Average wages were higher in Benton County than in Franklin County except in the wholesale and retail trade sector. In that sector, Franklin County has more wholesale trade, which typically pays higher wages than retail trade. Also, agriculture is a larger share of Franklin County's economy than Benton County's, although Benton County had a somewhat higher level of wages paid.
I.6.3.2 Labor Force
Data on occupations for 1990 show that the Benton County labor force is concentrated in the managerial and professional and the technical, sales, and administrative occupations, each of which accounts for about 30 percent of the work force (Table I.6.3.3). Franklin County has much lower percentages in these categories. Technical occupations and farming, forestry, and fishing (agricultural) occupations each accounts for about 21 percent of the Franklin County labor force. Franklin County also has a higher percentage of workers in the operators, fabricators, and laborers occupational category (17.3 percent) than Benton County (12.0 percent).
Table I.6.3.2 Average Wage by Industry in Benton and Franklin Counties and Washington State, 1992
Table I.6.3.3 Civilian Labor Force by Occupation Group, Sex, Race, and Hispanic Origin, 1990
Hispanics account for 6.9 percent of the Benton County labor force and 46.3 percent of the workers in the agricultural occupational category (Table I.6.3.3). In Franklin County, Hispanics are 28.3 percent of the labor force and 63.2 percent of the workers in the agricultural occupations. At the same time, Hispanics in Franklin County account for over 37 percent of the operators category and almost 28 percent of the precision production, craft, and repair occupations. In Benton County, Hispanics represent about 6 percent of the production occupations and 12 percent of the operators occupations. Among other non-Hispanic minority groups, the agriculture occupations have the smallest representation.
African Americans, who make up 0.9 percent of the labor force in Benton County, account for 1.4 percent of the managerial occupations, while in Franklin County African Americans account for 2.1 percent of the labor force and 2 percent of the managerial occupations. In Benton County, Native Americans account for a larger percentage of the production and operators than their percentage of the total labor force. In Franklin County, Native Americans account for a larger percentage of the managerial and production occupations than of the total labor force.
Asians and Pacific Islanders account for 2 percent of the labor force in Benton County and 2.7 percent of the managerial occupations. The same group accounts for 2 percent of the labor force in Franklin County but only 1.2 percent of the managerial occupations. Service occupations show the highest rate of Asian and Pacific Islander representation in both counties. Women account for 40.4 percent of the labor force in Benton County and 42.7 percent in Franklin county. Women account for 51.5 percent of the managerial and professional occupations in Benton County and 39.4 percent in Franklin County. In the other occupational categories the representation of women is similar or virtually the same in the two counties.
In terms of the Hanford Site (Table I.6.3.4), the Hanford Site's maintenance and operators contractor's work force is approximately 29 percent female, 4 percent Hispanic, 3 percent African American, 2 percent Asian, and 1 percent Native American (Pitcher 1994).
Table I.6.3.4 Hanford Site Management and Operations contractor Workforce Representation by Gender and Ethnic Group, 1994
I.6.3.3 Tax Base
Local government revenues in Benton and Franklin counties come primarily from property taxes and the local share of sales taxes. Other revenues come from fees, fines, forfeitures, and transfers from the State or the Federal government. In 1993, assessed property values were about $3.8 billion in Benton County and $1.3 billion in Franklin County. These assessed values were $500 million more than 1992 assessments in Benton County (15 percent increase) and $86 million more in Franklin County (7 percent increase). These increases reflect both new residential and commercial construction and increasing property values caused by the increased demand for residential and commercial property (Serot 1993).
In 1992, the last year for which complete data are available, taxable retail sales were $1,054 million for Benton County and $400 million for Franklin County. This represents a 14 percent increase for Benton County from 1991 levels and a 16 percent increase for Franklin County. Between 1988 and 1992, combined taxable retail sales for the two counties increased from $992 million to $1,481 million (WSDR 1987-1995). This represents almost a 50 percent increase or about 10.5 percent per year. The increase in taxable retail sales shows the effects of rising employment (leading to more consumer spending), population growth, and a general increase in economic activity (Serot 1993).
I.6.3.4 Housing
The growth in employment and population in the Tri-Cities MSA in the late 1980's and early 1990's created a tight housing market. Between 1988 and 1993, the average price of a single-family home increased from approximately $59,000 to $107,000. This increase occurred despite record levels of housing construction. Housing starts increased from 42 in 1988 to 1,200 in 1993 (Table I.6.3.5). However, recent declines in Hanford Site employment, as well as continued construction, resulted in a softening of the housing market and a decline in housing prices and housing starts in 1995 (TAR 1980-1995). The average home sale price in August 1995 was approximately $101,000, down from $126,000 in August 1994. However, most of the drop in home prices occurred in the upper prices ranges, with sales remaining strong in the $70,000 to $120,000 range. In September 1995, the Tri-City Association of Realtors described the local housing market as healthy (Schafer 1995).
Housing prices and housing starts in the Tri-Cities MSA have responded to changes in economic conditions during the past 15 years. Home prices declined after the termination of the Washington Public Power Supply System construction project in 1982 and then again after the shut-down of the Hanford Site's last production reactor in 1987. However, the Hanford Site cleanup and environmental restoration mission and increasing staffing levels, as well as growth in other sectors of the economy caused housing prices to increase dramatically. Until recently, despite new construction and new residences, first-time home buyers faced both rising prices and the lack of available housing, especially at the lower end of the price spectrum.
Table I.6.3.5 Tri-Cities MSA Home Prices and Housing Starts, 1980 to 1993
The housing problem was compounded by very low vacancy rates and increasing rents in rental housing. A December 1993 survey of apartment complexes in Richland, Kennewick, Pasco, and West Richland showed vacancy rates between 1.0 and 2.3 percent. Overall Tri-Cities housing occupancy rates (both single-family and multiple-unit housing) were approximately 95 percent in 1994 and 1995 (Cushing 1995 and Neitzel 1996 ).
|
NEWSLETTER
|
| Join the GlobalSecurity.org mailing list |
|
|
|