


4.14 UTILITIES AND ENERGY
This section discusses the utilities and energy supplies and consumption for LLNL Livermore site, LLNL Site 300, and SNL, Livermore. In several cases the LLNL Livermore site and SNL, Livermore receive utility services and energy resources through the same regional supply systems. While they are distinct operations managed and operated by different contractors, for purposes of this document the LLNL Livermore site and SNL, Livermore are addressed together because of their proximity. Even so, utility and energy usage is discussed separately for the LLNL Livermore site, LLNL Site 300, and SNL, Livermore as often as is feasible.
4.14.1 Water Consumption
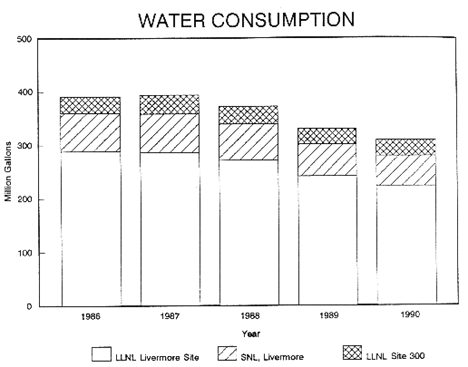
Overall water consumption for the three Laboratory sites has cumulatively decreased during the past 5 years, with a relative decrease for each site (Figure 4.14-1).
LLNL Livermore Site
The primary source of domestic water for the LLNL Livermore site is the City of San Francisco's Hetch Hetchy water system. An alternate backup source is Zone 7 of the Alameda County Flood Control and Water Conservation District (LLNL, 1991j). The LLNL Livermore site consumed an average of 261.8 million gal per year from 1986 through 1990. The water consumption rates, however, have declined steadily since 1986, down to 223 million gal in 1990.
Offsite Leased Properties
Additionally, there are four offsite leased properties that are significant water consumers: Vasco Road; Camp Parks; 2020 Research Drive; and Almond Avenue. These facilities have consumed about 3.1 million gal per year. The greatest water consumer is the Almond Avenue facility, which used a total of 7,658,024 gal between October 1987 and March 1991 or about 2,241,372 gal per year. The facility at 2020 Research Drive used 2,523,476 gal from November 1987 to March 1991 or about 757,042 gal per year; the Vasco Road facility used 638,014 gal during the period of March 1986 to March 1991 or about 127,602 gal per year; and the Camp Parks facility used 67,720 gal between April 1986 and March 1991 or about 13,774 gal per year. The City of Livermore provides water to 2020 Research Drive and Vasco Road facilities, whereas the California Water Services Company provides water to Almond Avenue. These properties are considered part of the LLNL Livermore site for purposes of discussion in this document.
LLNL Site 300
LLNL Site 300 is supplied with water from a system of wells. The existing capacity of usable wells is approximately 930,000 gal per day. The 5-year water consumption average for LLNL Site 300 is 31.8 million gal per year. The 1990 consumption was 30 million gal. LLNL Site 300 will be supplied with water pumped from the City of San Francisco's Hetch Hetchy water supply system by late 1993. The capacity of this new water supply is estimated to be 500,000 gal per day, with the capability of expanding to 1.2 million per day (LLNL, 1990b).
SNL, Livermore
As with the LLNL Livermore site, the primary source of domestic water for SNL, Livermore is the City of San Francisco's Hetch Hetchy water system. An alternate backup source is Zone 7 Alameda County Flood Control and Water Conservation District (LLNL, 1991j). SNL, Livermore consumed an average of 65.6 million gal per year from 1986 through 1990. The water consumption rates, however, have declined steadily since 1986, down to 56 million gal per year in 1990.
4.14.2 Electricity Consumption
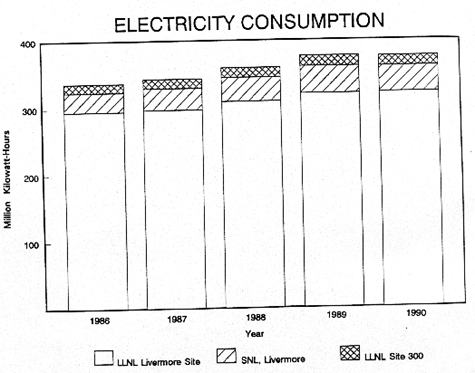
Total cumulative electricity consumption for LLNL and SNL, Livermore increased by 38,244,520 kilowatt-hours between 1986 and 1990. As shown on Figure 4.14-2, LLNL Livermore site uses the largest amount of electricity, followed by SNL, Livermore and LLNL Site 300. Electricity consumption for each facility increased between the years 1986 and 1989, but total cumulative electricity use decreased slightly from 1989 to 1990.
LLNL Livermore Site
Electrical power is supplied to the LLNL Livermore site and the offsite leased properties by Pacific Gas and Electric Company and the Western Area Power Administration. Electricity consumption increased each year between 1986 and 1990. The electrical energy used at LLNL is devoted almost entirely to the operation of office buildings and research laboratory facilities. Under DOE Guideline definitions of "building" and "metered process," LLNL space is classified as approximately 50 percent "building" and 50 percent "metered process" load. There are no single, dominant energy-consuming activities (such as an accelerator operation) or energy-intensive processes or installations (LLNL, 1991g). Based on 1990 records, the LLNL Livermore site consumes about 321.3 million kilowatt-hours per year (Hale, 1991). This represents only an estimated 3 percent of the total annual demand for residential, commercial, industrial and other consumers in Alameda County.
Offsite Leased Properties
The offsite leased properties (Camp Parks; 2020 Research Drive; Vasco Road; Greenville Road; and Almond School) are part of the LLNL metered and/or building process load. In addition, the Mocho Pumping Station is included in the metered and/or building process load. Cumulatively, electricity consumption by the offsite leased properties has increased steadily since 1986.
LLNL Site 300
Electric power is supplied to LLNL Site 300 by Pacific Gas and Electric Company and the Western Area Power Administration. Total cumulative electricity consumption showed little increase between the years 1986 and 1989. Electricity use declined slightly at LLNL Site 300 during 1989 and 1990.
Based on 1990 records, LLNL Site 300 consumes about 1.5 million kilowatt-hours of electricity annually. This represents about 0.3 percent of the total estimated annual demand for San Joaquin County.
SNL, Livermore
Electric power is supplied to SNL, Livermore by Pacific Gas and Electric Company and the Western Area Power Administration. Electricity use increased slightly between the years 1986 and 1989 at SNL, Livermore, and declined slightly during 1989 and 1990.
Based on 1990 records, SNL, Livermore consumes about 38.7 million kilowatt-hours of electricity per year. This represents about 0.4 percent of the total estimated annual electrical energy demand for Alameda County.
4.14.3 Fuel Consumption
LLNL Livermore Site
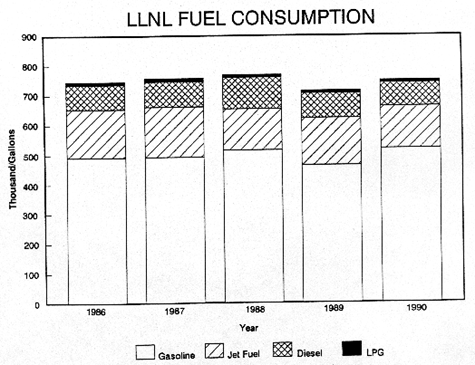
As shown in Figure 4.14-3, gasoline is the primary fuel consumed at LLNL, followed by jet fuel, diesel, and LPG (liquid propane gas). The cumulative totals for LLNL show an increase in gasoline consumption, and a decrease in diesel and jet fuel consumption. LPG consumption has remained constant during the past 3 years, but reflects a decrease from 1986 and 1987 totals. The 5-year averages for LLNL are gasoline, 496,200 gal per year; diesel, 86,600 gal per year; jet fuel, 155,800 gal per year; and LPG, 10,400 gal per year.
Natural gas is supplied to the LLNL Livermore site by Pacific Gas and Electric Company. Natural gas consumption for the LLNL Livermore site increased during each year from 1986 to 1989, but decreased in 1990. The 5-year average for the LLNL Livermore site is 3.69 million therms per year. The satellite locations that use natural gas are the Vasco Road; Camp Parks; 2020 Research Drive; and Almond Avenue facilities. The cumulative total for these four facilities during 1990 is 28,800 therms. One therm is equivalent to 100,000 British thermal units (Btu). Natural gas is used mostly for comfort heating in the building category. In the metered process category, natural gas is used mostly for programmatic experimental use, and for some comfort heating as well. Continuing efforts to decrease energy use include modification to heating, ventilation, and air conditioning (HVAC) controls; the design of more efficient buildings; boiler tuneups; and other site energy conservation efforts.
LLNL Site 300
LLNL Site 300 fuel oil consumption has decreased significantly since 1986, with a 5-year average of 78,114 gal per year. Fuel oil is used mostly for comfort heating in the building category. In the metered process category, fuel oil is used for comfort heating and in some experiments. The completion of HVAC retrofit projects and mild temperatures have contributed to the overall decrease in fuel oil consumption.
SNL, Livermore
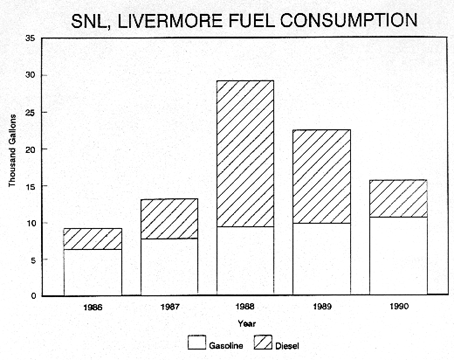
As shown in Figure 4.14-4, gasoline consumption at SNL, Livermore increased over each of the past 5 consecutive years, while diesel consumption increased from 1986 to 1988, but has been decreasing since its 1988 high. The 5-year averages for gasoline and diesel are 8734 and 9162 gal per year, respectively. At SNL, Livermore, 106 sixteen-ounce propane cylinders of LPG were used in the maintenance area during the past 5 years. The average LPG usage per year at SNL, Livermore is approximately 21 cylinders per year. Natural gas is supplied to SNL, Livermore by Pacific Gas and Electric Company. Consumption at SNL, Livermore increased during each year from 1986 to 1989, but decreased in 1990. Diesel fuel consumption followed the trend for LLNL, with a general increase between years 1986 and 1988 followed by a significant decrease in 1989.
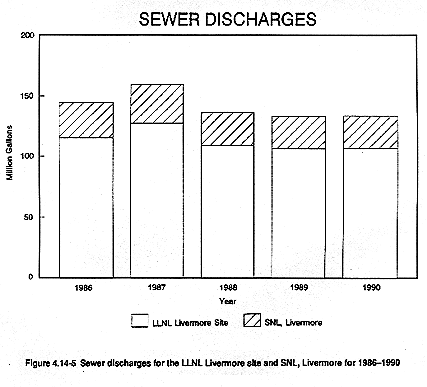
4.14.4 Sewer Discharges
The City of Livermore sewage treatment facility currently receives a total of approximately 4.5 million gal of effluent per day. The capacity of this facility is 5 million gal of effluent per day. The facility is currently being expanded and the completion date is anticipated in 1994. When completed, the facility would be able to treat 8.5 million gal per day which is expected to be sufficient for inflow treatment for the next 10 years. Projected sewer discharge volumes could be treated at the City of Livermore treatment facility even without the proposed expansion of this facility. Therefore, the cumulative impacts associated with the Laboratories' contribution of sewage discharge is less than significant.
The City of Livermore Water Reclamation Plant (LWRP) handles sewage from LLNL and SNL, Livermore. Sewage flows through two main laterals on the east and west sides of the site, combines in a flow-measuring flume near Building 196 (located at the northwest corner of LLNL Livermore), then leaves the site and enters the City of Livermore's sewer system. Figure 4.14-5 shows the cumulative sewer discharges for the LLNL Livermore site and SNL, Livermore for the years 1986 through 1990. Current daily flows average 366,000 gal, with a peak of 710,000 gal per day. A sewer diversion facility was completed in the spring of 1991 to protect City of Livermore treatment facilities against accidental contamination (LLNL, 1991j).
LLNL Livermore Site
The 5-year sewer discharge average for the LLNL Livermore site is 113.2 million gal per year. Most discharges to the sanitary sewer system at the LLNL Livermore site are considered batch discharges, since they occur on a sporadic basis. Because these discharges occur randomly on an as-necessary basis, there is considerable variation both in the number of discharges per month and in the time of day of the discharges. One exception is the cleaning of cooling towers. Generally, each tower is emptied once a year, usually during the winter months, when demand on the towers is lower, and on weekends, when more capacity is available in the LLNL Livermore site sewer system (LLNL, 1990i).
There are four principal sources of large-volume batch discharges. They are air washes, cooling towers, boilers, and wastewater treatment/retention tanks. The amount of releases to the sanitary system varies substantially for each. These four principal sources of large-volume batch discharges are briefly discussed below (LLNL, 1990i).
Air Washes
There are 26 building air washes, which range from about 4 to 1500 gal in capacity. Each air wash is cleaned and the water released to the sanitary sewer once a year at a rate of about 15 gal per minute. Only one air wash is cleaned at a time.
Cooling Towers
There are six sets of cooling towers, with a total of seventeen cells. The cooling towers are located at Buildings 251, 291, 325, 412, 435, and 511. The cooling tower complexes have capacities ranging from 20 to 252,000 gal. Each tower is cleaned and the water released once a year. Only one tower is cleaned on a given day, and the flow is controlled to release at a rate that would not overflow the sewer monitoring weir. Unlike other discharges, the cooling towers are generally emptied on weekends and on colder days. The maximum discharge occurs when the largest tower is cleaned; that discharge includes five cells, totaling approximately 150,000 gal.
Boilers
There are 110 boilers on the LLNL Livermore site, of which 23 are steam boilers and 87 are hot water boilers. Only the steam boilers have regular blowdown release, and 8 of the steam boilers have a continuous, rather than batch, blowdown. The remaining 15 steam boilers discharge approximately 5 to 10 gal, at a rate of 5 to 6 gal per minute, three times per week. Other than the eight continuous discharges, blowdown of the boilers is a manual procedure, and only one boiler is released at a time.
All the boilers are emptied once a year for cleaning, and they could be emptied for maintenance, if necessary. There are 23 large boilers that hold an average of about 1500 gal, and there are 87 boilers that contain an average of 400 gal.
Wastewater Treatment/Retention Tanks
The LLNL Livermore site has a total of 33 buildings that have wastewater retention systems, including the liquid waste treatment area. Each of those systems contains sumps or tanks that can make releases to the sewer if concentrations of the constituents in the system meet discharge limitations; however, the contents of some of the retention systems are never released to the sewer. Most of the retained wastewater is generated at the LLNL Livermore site, but some wastewater is received from LLNL Site 300 for treatment or discharge to the sanitary sewer or for disposal as a hazardous waste.
During the period of January to July 1990, the LLNL Livermore site discharged the contents of an average of 12 retention or treatment tanks to the sanitary sewer each month. Retention tank and sump volumes range from approximately 100 to 5000 gal; the average volume released to the sewer is 1000 gal. The flow from the tanks is approximately 25 to 30 gal per minute, except for the treatment tanks at Building 514, which can discharge 100 gal per minute because of their large pumps.
When wastewater is discharged to the sewer system, it combines with other sewage from LLNL and SNL, Livermore. The combined flow leaves the LLNL Livermore site at Building 196, the Sewage Monitoring Station. The LLNL Livermore site Sewage Monitoring Station is equipped with a continuous monitoring system designed to detect radiation, excessive pH, and metals. The monitoring system does not stop the flow of wastewater to the City of Livermore, but does provide a warning that an unacceptable release may be flowing toward the Livermore Water Reclamation Plant. Releases can be diverted into a City of Livermore holding basin for further analysis and disposition. It takes approximately 3 hours for sewage to reach the Livermore Water Reclamation Plant from the monitoring station; therefore, the city has adequate time to divert the flow if necessary (Grandfield, 1989).
To protect the Livermore Water Reclamation Plant and to minimize any cleanup that might become necessary, the LLNL Livermore site has constructed an onsite sewage diversion and retention system. This system is capable of containing approximately 200,000 gal of potentially contaminated sewage until analyses can be completed and appropriate handling methods are determined. This system would contain approximately 6 hours of total discharge from the SNL, Livermore and LLNL facilities. The system ensures that, if the alarm is triggered by the flow, all but the first few minutes of flow is retained at LLNL for evaluation of appropriate treatment for disposal.
In addition to continuous monitoring of the effluent, sewer samples are collected from both the Sewer Monitoring Station (Building 196) and the Livermore Water Reclamation Plant. Samples are analyzed daily for radioactivity and are composited monthly to determine the concentrations of specific isotopes (cesium-137 and plutonium-239) and various metals.
The 1990 annual average wastewater radionuclide concentrations (LLNL, 1991f) included 9.86×10⁻¹¹ mCi/mL for cesium-137, 13.0×10⁻¹² mCi/mL for plutonium-239, and 1.46×10⁻⁶ mCi/mL for tritium. A total of 0.68 Ci of tritium was released in wastewater during 1990 by LLNL and SNL, Livermore, representing 70 percent of the State limit of 1 Ci/year and approximately 0.021 percent of DOE annualized limit requiring application of best available technology to control sewer effluent releases (LLNL, 1991d). The discharges of plutonium-239 and cesium-137 represented even smaller portions of their respective DOE limits (LLNL, 1991f). The LLNL 1990 annual environmental monitoring report (LLNL, 1991f) reports that LLNL is in compliance with all regulations and guidelines governing releases of radioactivity to the sanitary sewer.
Potential exposure pathways for workers at the Livermore Water Reclamation Plant include inhalation and incidental ingestion of tritium, plutonium-239, and cesium-137 and dermal absorption of tritium (plutonium and cesium are not readily absorbed through intact skin). Using conservative exposure parameters, an effective dose equivalent of approximately 0.0002 rem from ingestion and 0.0004 rem from inhalation and absorption through the skin was estimated.
Historically, practices at the Livermore Water Reclamation Plant have resulted in soil and sediment contamination. The highest concentration of plutonium-239 in soils were at three Livermore Water Reclamation Plant locations (LLNL, 1991f). The average plutonium concentration at these locations is 86×10-9 mCi plutonium-239 per gram of soil, resulting in an annual effective dose equivalent of 0.000001 rem (0.001 mrem)/yr. This is 0.001 percent of the primary public radiation protection standard of 0.1 rem (100 mrem)/yr effective dose equivalent.
The effluent is sampled and analyzed quarterly for a number of specific parameters. Also quarterly, samples are collected at the point of discharge of specified metal finishing and electrical and electronic component categorical processes to ensure compliance with EPA discharge limits for those processes.
Based on this monitoring, it has been determined that Livermore Water Reclamation Plant workers may be exposed to potentially toxic substances in sewage and sludge from treatment. A risk assessment examining exposure of workers to the toxic substances in the sewage was conducted using EPA methods (EPA, 1989a, 1989b). The chemical concentrations in the sewage sludge were from the 1990 monitoring data (LLNL, 1991f). It was assumed that workers were exposed to the sewage via incidental ingestion and dermal absorption. Daily intakes were estimated for an arbitrary exposure duration of 8 hours per day, for a 5-day work week, for 7 years. Estimated daily intakes ranged from 6.3×10⁻⁷ mg/kg-day for zinc to 1.0×10⁻¹¹ mg/kg-day for beryllium.
The estimated daily intakes were compared to acceptable intakes in order to estimate the hazard index. The total noncarcinogenic hazard index was at 7×10⁻⁵ (i.e., less than one ten-thousandth of levels that are estimated as safe). The total lifetime carcinogenic risk was calculated to be about 0.002 in a million.
LLNL Site 300
LLNL Site 300 sanitary sewage generated outside the General Services Area is disposed of through septic tanks and leachfields or cesspools at individual building locations. Sanitary sewage generated at the General Services Area is piped into an asphalt-membrane-lined oxidation pond east of the General Services Area at an average rate of 3500 gal per day (LLNL, 1991r).
Wastewater discharges from LLNL Site 300 are handled in a variety of ways. In the General Services Area, wastewater is treated and disposed of in an oxidation pond with overflow to an evaporation-percolation pond. General Services Area sewage is domestic in nature.
In the process and chemistry areas, industrial wastewater goes through a clarifier and weir system and is discharged to two Class II surface impoundments located south of Building 817. Wastewater from the chemistry buildings and photo lab rinsewaters are trucked to the clarifier/weir system for treatment prior to discharge into the surface impoundment. High explosive process waste from the machining area and pressing facility is plumbed directly to the treatment system (UC, 1987).
Cooling tower wastewater from the various LLNL Site 300 operations is currently discharged, in accordance with the prescribed permit conditions, to onsite surface water drainage courses. Discharges to surface water bodies would be eliminated at many of the cooling towers. This effluent would be disposed of via leachfields. Other industrial wastewater generated at LLNL Site 300 is stored in retention tanks, drummed, and hauled to the LLNL Livermore site for reprocessing and/or disposal.
SNL, Livermore
The sanitary sewer outfall from SNL, Livermore is located adjacent to Building 911 on the north perimeter of the site. The liquid effluent flows from SNL, Livermore into the LLNL Livermore site sewer system. In addition to monitoring total sewer outfall at LLNL Building 196, an on-line monitoring system is maintained by SNL, Livermore at the sanitary sewer outfall connection to LLNL. This system continuously measures the pH and flow of the exiting waste stream. A composite sampler continuously collects samples of the sewer effluent at the discharge point from SNL, Livermore. These samples are analyzed weekly to demonstrate compliance with the SNL, Livermore wastewater discharge permit conditions (Brekke, 1991).
At SNL, Livermore wastewater from laboratories and other operations that could adversely impact the operations of the City of Livermore Water Reclamation Plant is discharged into retention tanks. The contents of these tanks are monitored prior to discharge to the sanitary sewer to ensure that concentrations of constituents are below the limits imposed by the City of Livermore Wastewater Discharge Permit. If the contents of these tanks cannot meet that standard they are treated as hazardous waste and handled accordingly.
Wastewater that is generated by SNL, Livermore categorical processes, by the electroplating laboratory in Building 913, and by the printed wire laboratory in Building 910 must comply with the metal finishing pretreatment standards. The EPA established these discharge standards based on the best available control technology economically achievable (Brekke, 1991).
4.14.5 Conservation and Recycling
LLNL Livermore Site
The Energy Management Program is responsible for reducing LLNL overall energy consumption and reducing the impact of energy costs on Laboratory site operations. This is primarily accomplished through energy conservation, awareness, and efficiency.
DOE has mandated that LLNL will attain a goal of 10 percent energy reduction by 1995 using 1985 energy consumption as a baseline. To achieve this goal, the Energy Management Program performs studies and conducts surveys to identify opportunities for retrofit projects to reduce energy use at the Laboratory. The Energy Management Program is also responsible for the evaluation and promotion of alternate and renewable energy sources (LLNL, 1991g).
A portion of the nonhazardous waste that is generated is sold for recycling or reuse, as described in section 4.15.
LLNL is committed to reducing water use during this time of drought and to using water in a conservative manner. Beginning in 1988, LLNL began curtailing water use by implementing several water conservation measures. The following water use limitations and/or restrictions exist at LLNL:
- Reducing landscape watering to 35 percent below 1989 levels.
- Reducing blowdown in cooling towers to minimal operable levels.
- Limiting use of car wash to only that which is essential.
- Not washing down sidewalks, walkways, driveways, and so on with water.
- Using reclaimed ground water in place of potable water in cooling towers to the greatest extent possible.
- Postponing all new contracts for additional water-intensive landscaping (i.e., lawn and ground cover).
- Monitoring all water use to discourage waste or unnecessary use.
In 1988, LLNL constructed a two-cell recharge basin at SNL, Livermore to investigate the feasibility of conserving the local ground water resource through surface recharge. The recharge basin has been receiving treated ground water from treatment facility "A" since early 1989. Since then, about 6.5 million gal of treated ground water have been discharged to the eastern cell. On December 12, 1989, roughly one year from start of operation, the western cell began receiving treated water from treatment facility "A." Over 6 million gal of treated water have been discharged to the western cell through May 1990. The recharge basin has performed effectively, with an estimated 92 to 98 percent of the treated water recharged (Isherwood et al., 1990).
SNL, Livermore
The energy management organization at SNL, Livermore has developed a plan to survey the site for alternate energy capabilities and ways to reduce usage, to set goals to achieve the DOE mandated reduction of 10 percent by 1995, to increase employee awareness through bulletins and posters, and to analyze and monitor results for continued improvement. Water conservation efforts especially during the drought are achieved through cutbacks in irrigation, cooling, and domestic water use. Any new or replacement landscaping is done with conservation measures in mind, such as the use of ornamental wood chips and low water level sprinklers.
SNL, Livermore is currently conducting recycling programs in three major categories: low-level radioactive and mixed wastes, hazardous wastes, and nonhazardous wastes. The following summarizes recycling programs for these categories (SNL, Livermore, 1991m).
Low-Level Radioactive and Mixed Wastes
- Tritium used at the tritium research lab is recaptured and recycled to the maximum extent possible.
- High-level tritiated water effluent is packaged in the AL-M1 container and shipped offsite for eventual recycling.
Hazardous Wastes
- All batteries.
- Mercury and fluorescent light tubes.
- Coolants and petroleum oil containing less than 1 percent chlorinated solvents and no PCBs or metals.
- Drums containing oil residues.
- Silver from photo chemicals (fixers and developers).
- Solvents.
- Lead waste.
Nonhazardous Wastes
- A program is underway through the plant maintenance department to reduce the amount of yard waste sent to the landfill. A wood chipper would be used to mulch tree trimmings and leaves into compostable material. This end product would be used onsite and documented by the plant maintenance department. Early estimates of this waste stream are a 10 percent reduction in landfill material.
- SNL, Livermore has supported a metal recycling program for several years. Assorted metals are collected and sold to an outside vendor for sorting and recycling.
- Classified and sensitive paper waste has been in a recycle stream for the past 6 years. SNL, Livermore classified waste is sent to LLNL for processing. The waste is then shipped to a paper products manufacturer.
- A pilot paper recycling program is progressing for unclassified paper. This project would be used to design a sitewide implementation plan.
- An employee recycling program to collect aluminum soda cans has been started. This is strictly a volunteer effort and the proceeds are given to charity.
LLNL Site 300
A variety of recycling programs are currently practiced at LLNL Site 300 as described in section 4.15.
|
NEWSLETTER
|
| Join the GlobalSecurity.org mailing list |
|
|
|