APPENDIX C
HYDROLOGIC AND HYDRAULIC TABLES AND CURVES
PRECIPITATION TABLES
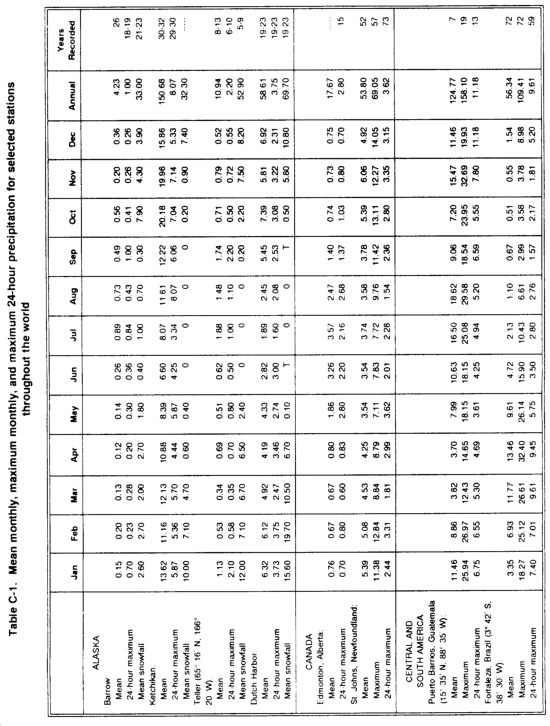
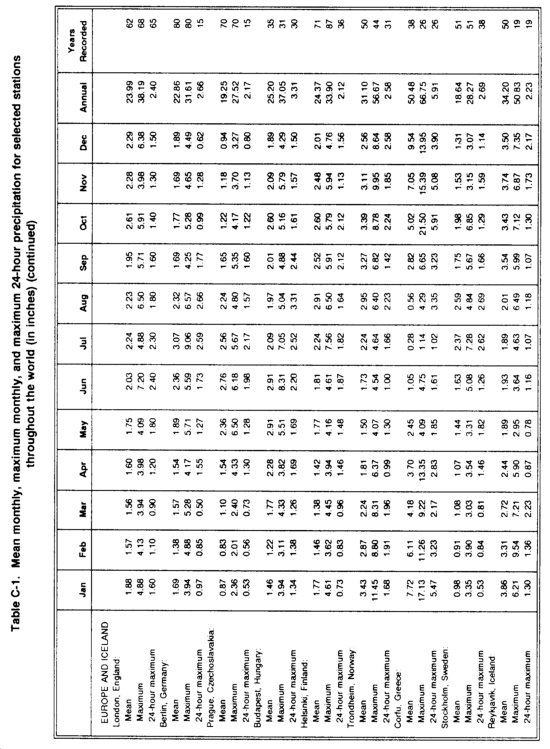
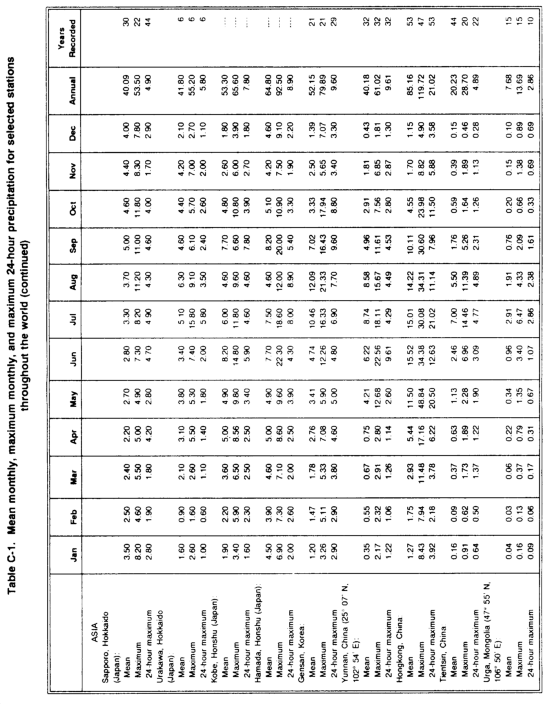
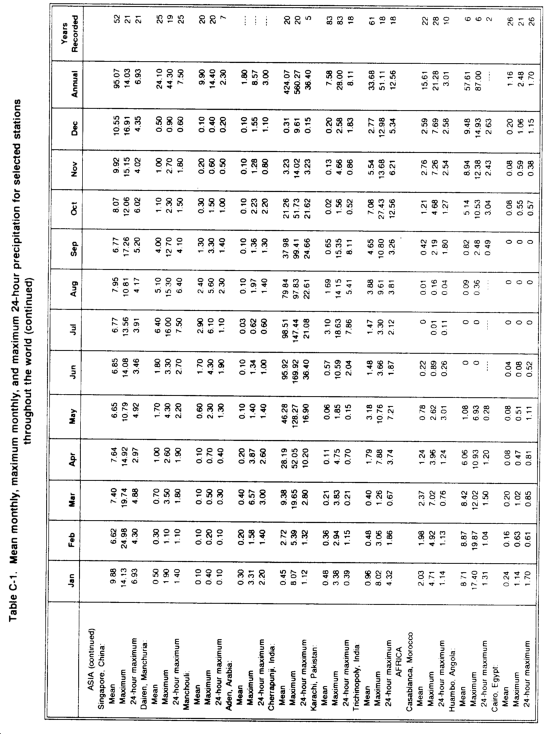
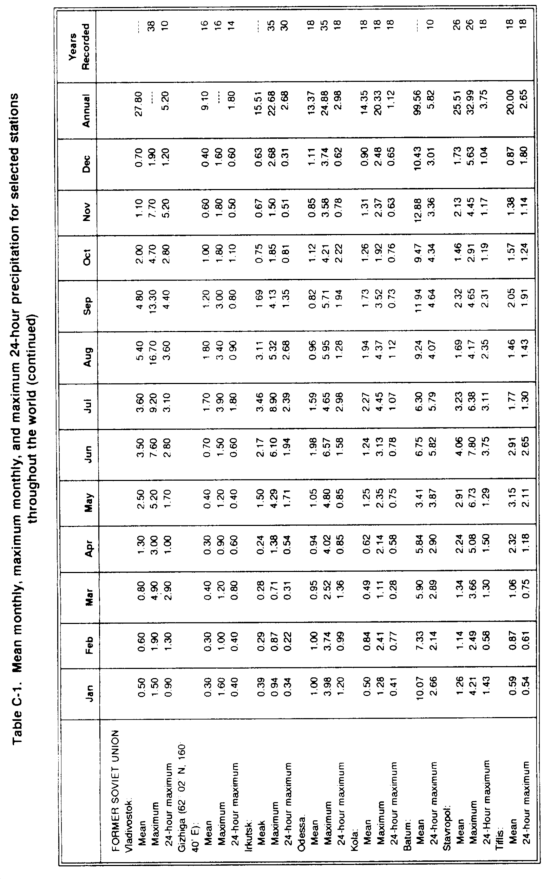
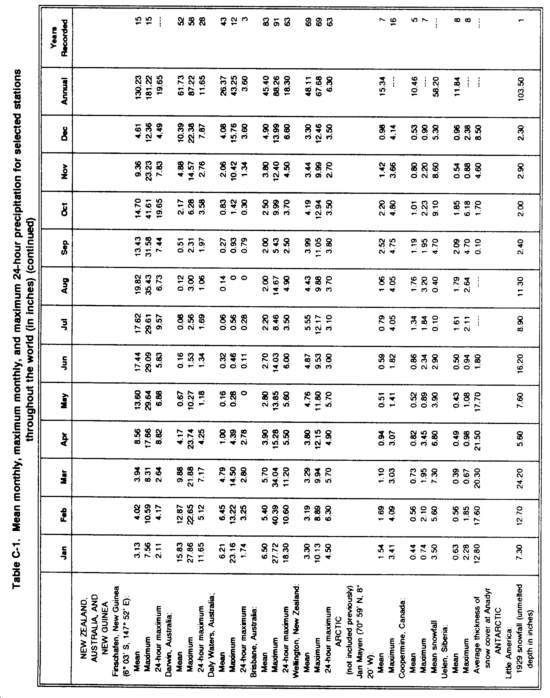
Table C-1, provides local data for use in designing drainage systems as discussed in Chapter 6.
HYDROLOGIC SUPPLY CURVES FOR OVERLAND FLOW
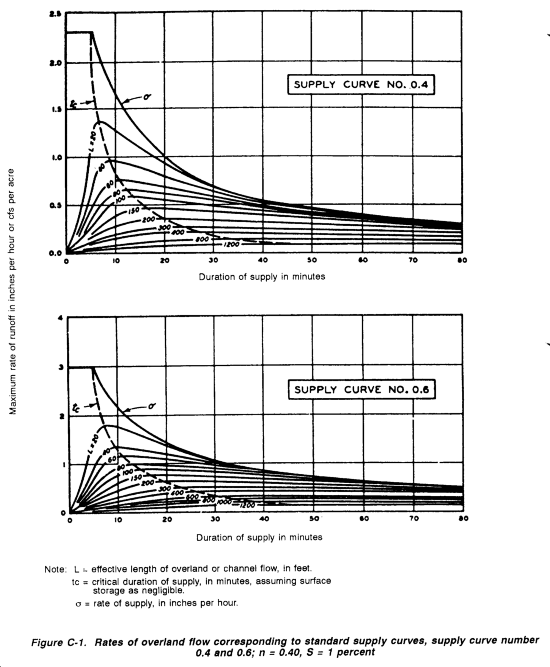
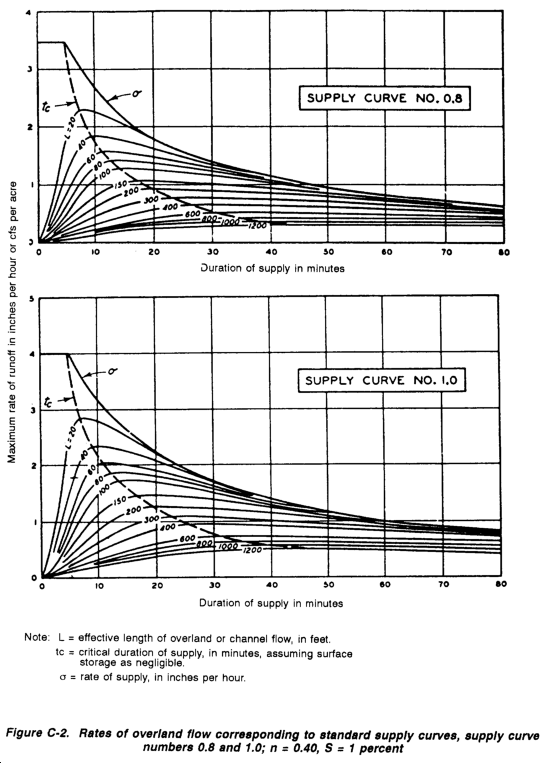
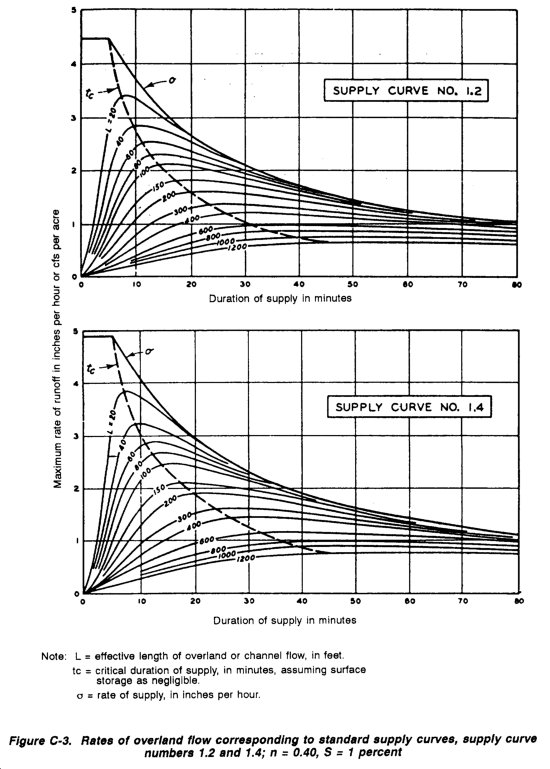
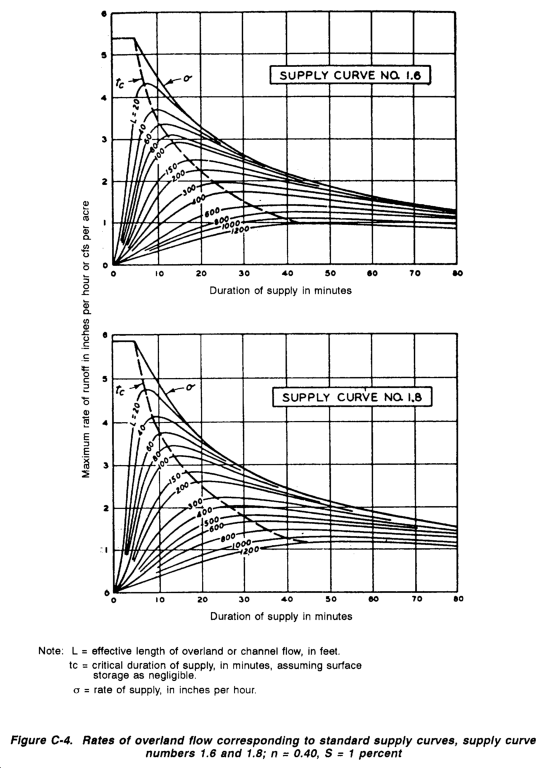
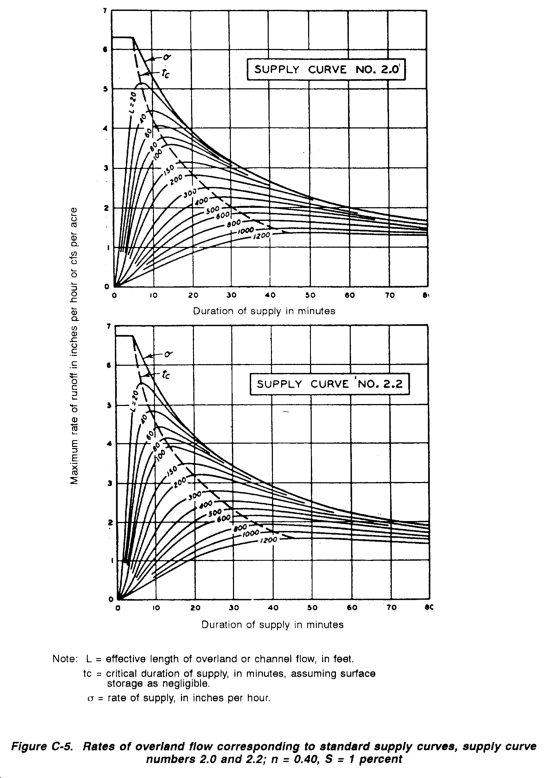
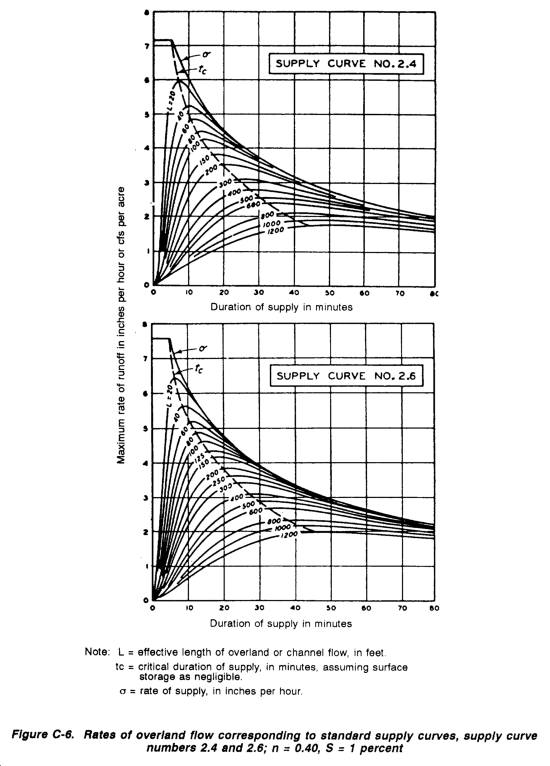
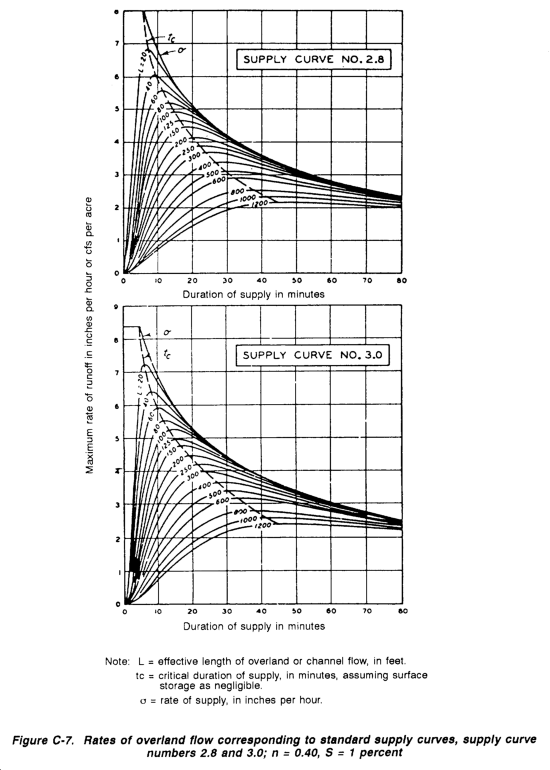
Figures C-1 through C-7, represent the peak runoff rates from individual storm events of various durations, all of which have the same average frequency of occurrence.
These curves are computed from Horton's equation given in Chapter 6, using a retardance coefficient in n = 0.04 and hydraulic gradient S = 1 percent.
HYDRAULIC CHARACTERISTICS OF SELECTED DRAINAGE CHANNELS
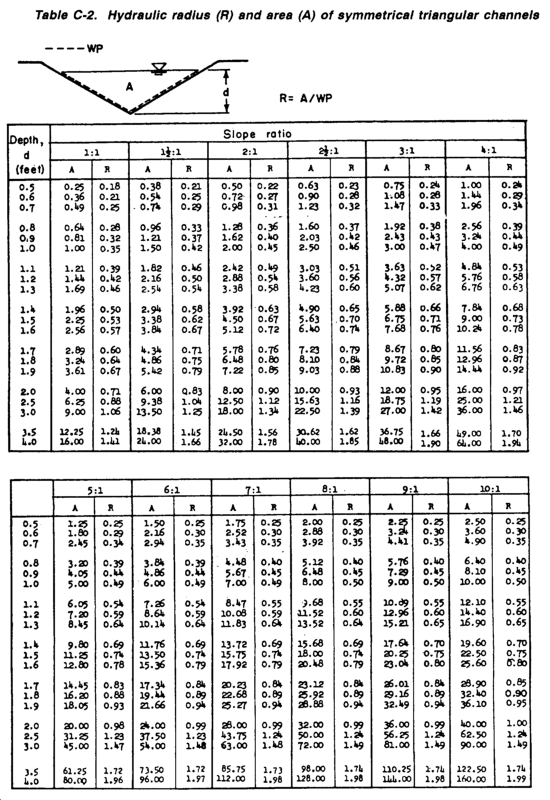
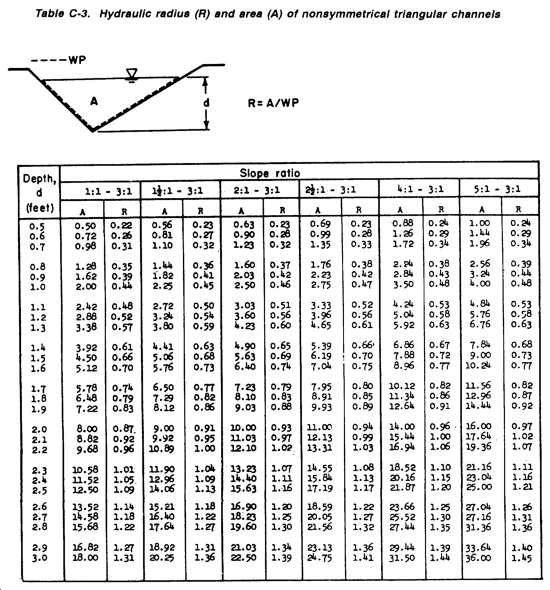
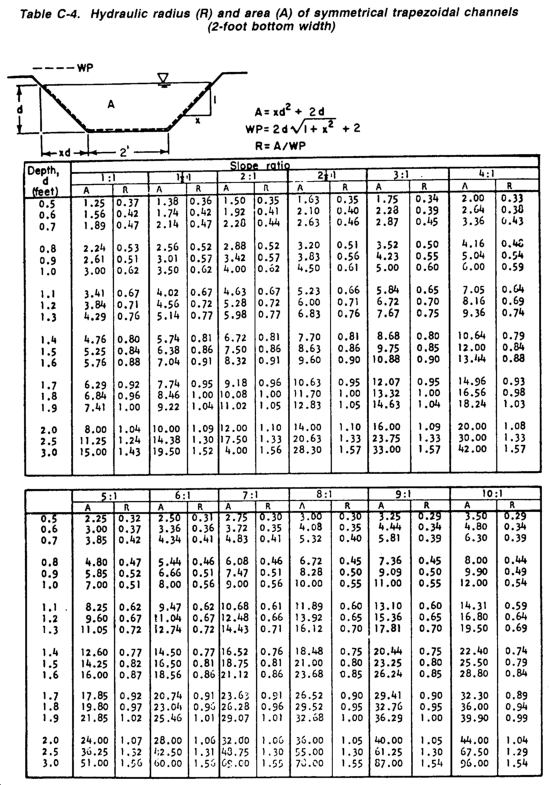
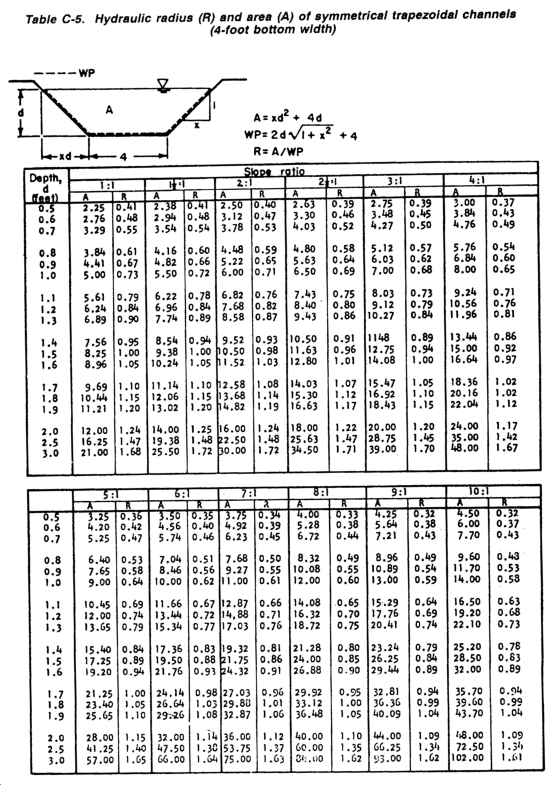
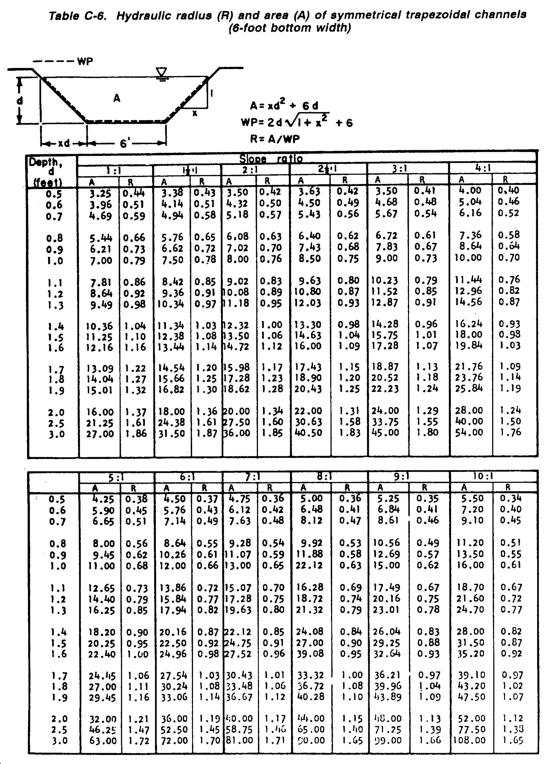
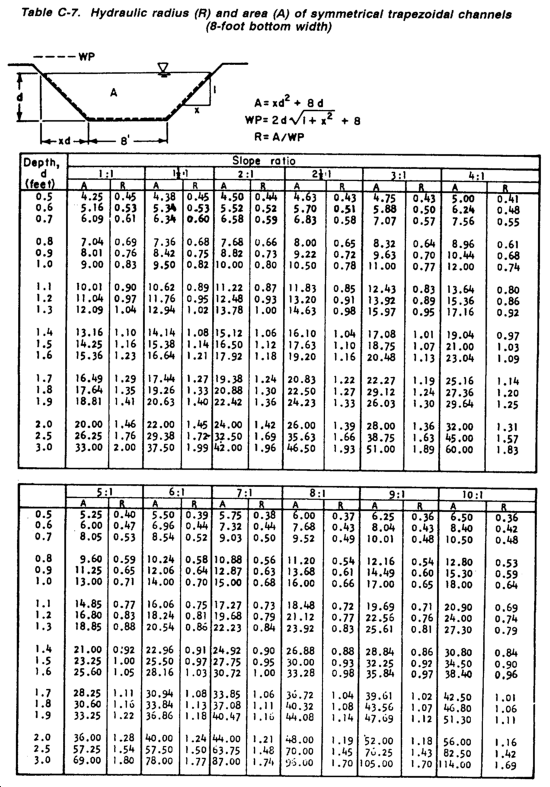
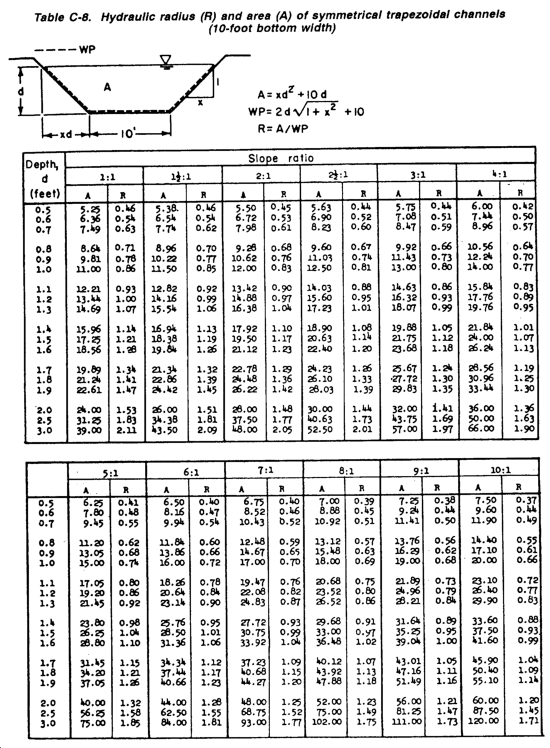
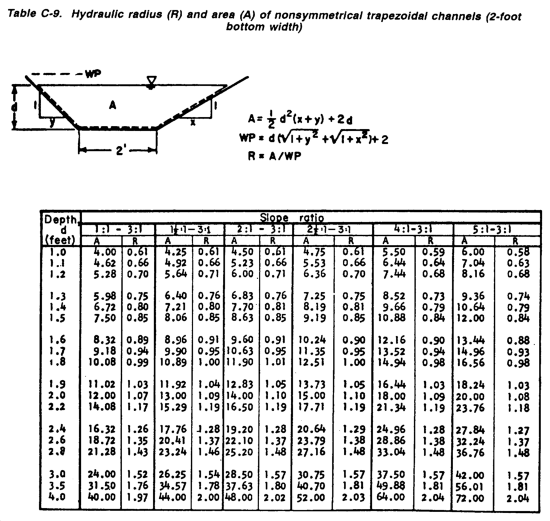
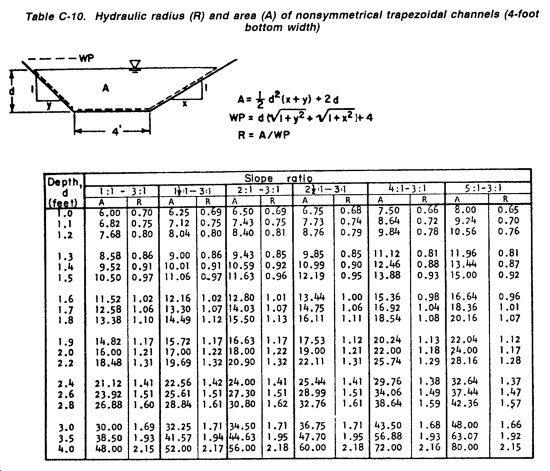
Tables C-2 through C-10, present commonly used ditch sections, with cross-section areas and hydraulic radius, to facilitate selection of ditch size and shape.
|
NEWSLETTER
|
| Join the GlobalSecurity.org mailing list |
|
|
|


