


B.11.0 ALTERNATIVES DATA
The following statistical section provides a direct comparison of the various alternatives. The data are grouped in the following categories and arranged so the alternatives can be compared:
- Schedule for each alternative (Table B.11.0.1) ;
- Cost summary for tank waste and capsule alternatives ( Tables B.11.0.2 and B.11.0.3);
- Resource summary for tank waste and capsule alternatives (Tables B.11.0.4 and B.11.0.5);
- Radiological emissions summary (Table B.11.0.6);
- Nonradiological emissions summary ( Table B.11.0.7) ; and
- Transportation summary for tank waste and capsule alternatives (Tables B.11.0.8 and B.11.0.9).
Table B.11.0.1 Schedule - Tank Waste and Capsule Alternatives
Table B.11.0.2 Cost Summary for Tank Waste Alternatives 1
Table B.11.0.3 Cost Summary for Capsule Alternatives 1
Table B.11.0.4 Resource Summary, Tank Waste Alternatives
Table B.11.0.5 Resource Summary, Capsule Alternatives
Table B.11.0.6 Radiological Emissions (Curies), Tank Waste Alternatives 1, 3
Table B.11.0.7 Nonradiological Emissions, Tank Waste Alternatives 1
Table B.11.0.8 Transportation Summary by Tank Waste Alternative
Table B.11.0.9 Transportation Summary by Capsule Alternative
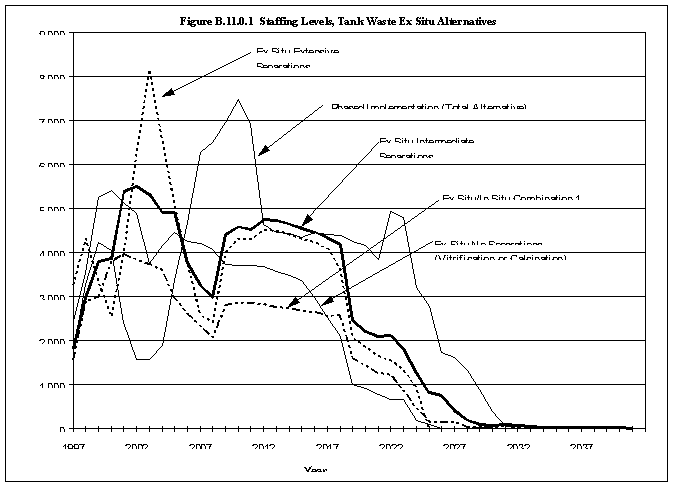
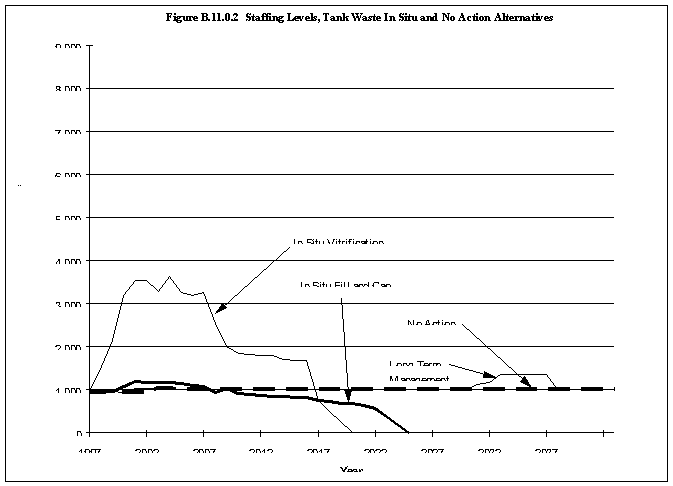
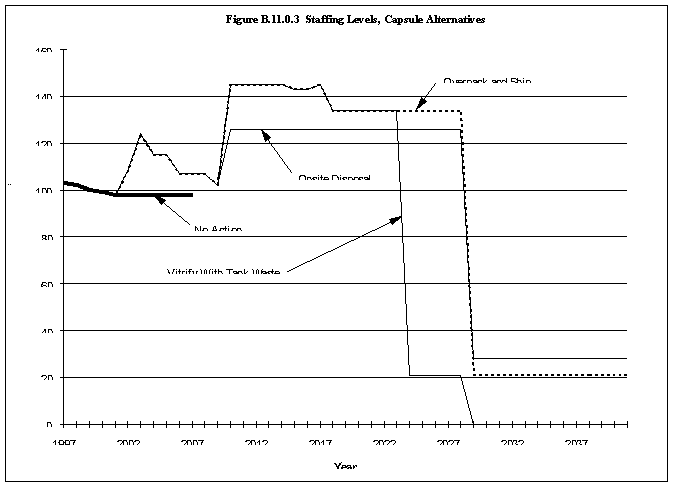
In addition to the tables, effort-power requirements in effort years are presented in graphs to provide a direct comparison of the alternatives (Figures B.11.0.1, B.11.0.2, and B.11.0.3). The graphs do not extend beyond the years 2040, after which staffing requirements are minimal.
Figure B.11.0.1 Staffing Level, Tank Waste Ex Situ Alternatives
Figure B.11.0.2 Staffing Levels, Tank Waste In Situ and No Action Alternatives
Figure B.11.0.3 Staffing Levels, Capsule Alternatives
Appendix B References are unavailable electronically.
|
NEWSLETTER
|
| Join the GlobalSecurity.org mailing list |
|
|
|