

Income Inequality
According to World Bank, the Gini coefficient, which measures inequality in income distribution, in the US has gone up from 0.353 in 1974 to 0.415 in 2019, exceeding the warning level of 0.4, which indicates a large income gap. The problem was further exacerbated by the onslaught of COVID-19, when economic recession led to massive job losses and further deterioration in the economic situation of low-income earners. At the same time, excessive money supply and large-scale fiscal spending have driven up stock and housing prices, bringing enormous benefits to wealthier asset owners.
A Fed report on household wealth stated the total wealth of the richest 1 percent reached a record $45.9 trillion at the end of the fourth quarter of 2021, and their fortunes increased by more than $12 trillion, or more than a third, during the course of the pandemic. The widening wealth gap has also led to the middle class shrinking. Fortune magazine reported in November 2022 that 61 percent of US adults were considered middle class in 1971, a figure that dropped to just 50 percent in 2021, according to an analysis from Pew Research Center. Fewer Americans consider themselves to be middle class than before the Great Recession.
The widening wealth gap is one of the main causes of the deepening social crisis in the US. Problems including growing ethnic conflicts, increasing homelessness, urban riots and violent crimes are all closely related to it. The rich have tried every possible mean to "legally" avoid paying their dues. According to a report by the news outlet ProPublica, the true tax rate of the richest Americans is only 3.4 percent, far lower than that of ordinary wage earners.
The annual GDP of the US is $20.5 trillion and at its heart is an underclass of people whose purchasing power is being suppressed at an industrial scale. The distribution of income and wealth in the United States has been widening more or less steadily for several decades, to a greater extent than in most advanced countries. This trend paused during the Great Recession because of larger wealth losses for those at the top of the distribution and because increased safety-net spending helped offset some income losses for those below the top. But widening inequality resumed in the recovery, as the stock market rebounded, wage growth and the healing of the labor market have been slow, and the increase in home prices has not fully restored the housing wealth lost by the large majority of households for which it is their primary asset.
A September 2020 analysis by CitiGroup showed that "if four key racial gaps for Blacks wages, education, housing, and investment were closed 20 years ago, $16 trillion could have been added to the U.S. economy. And if the gaps are closed today, $5 trillion can be added to U.S. GDP over the next five years.... , or an average add of 0.35 percentage point to U.S. GDP growth per year and 0.09 percentage point to global growth per year"
To invest in angel and private equity funds, venture capital, hedge funds, , and other private placements an investor is required to be an Accredited Investor. In the US, having net worth of $1,000,000+ not including primary home equity is the most common way to qualify. The Securities Act of 1933, §230.501, lays out the exact terms and definitions to be an Accredited Investor. The three most common ways of accreditation for an individual/household are the following: $1,000,000 in net worth outside Equity in a Primary Residence; (or) One household member earning $200,000 the last two straight years and expecting it to continue in the current year; (or) With a spouse, earning $300,000 the last two straight years and expecting it to continue in the current year. There are roughly 12.4 million accredited investor households, and around 11.3 million qualify through net worth. Investors can also qualify through individual or household income. This is less than 10% of the population of 125,981,700 United States households.
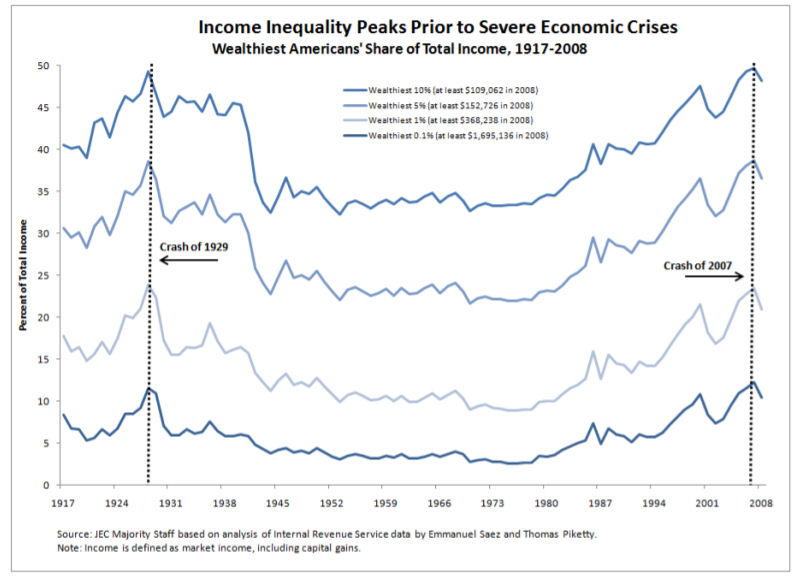
The past several decades have seen the most sustained rise in inequality since the 19th century after more than 40 years of narrowing inequality following the Great Depression. By some estimates, income and wealth inequality are near their highest levels in the past hundred years, much higher than the average during that time span and probably higher than for much of American history before then. It is no secret that the past few decades of widening inequality can be summed up as significant income and wealth gains for those at the very top and stagnant living standards for the majority.
At the top of the income classes is the upper class. There is no single definition of whom this includes. Many think of the upper class in terms of the 1%. To be in the richest 1% nationally, a household needs to have the annual income of at least $389,436, according to the Economic Policy Institute.
According to census data from 2015, 6.1% of households bring in $200,000 and higher every year and 14.1% bring in between $100,000 and $150,000. This is the upper middle class. An Urban Institute paper argued that what they referred to as upper middle class, or those with a three-person household income between $100,000 and $350,000, has grown from 12.9% of the population in 1979 to 29.4% in 2014. It found that people with higher incomes saw their earnings grow faster than those with lower incomes.
The Census Bureau says that 41.5% of American households brought in between $35,000 and $100,000 in 2015. Twenty-six percent of American households earn more than that and 32% earn less. The Urban Institute defined the middle class as adults with size-adjusted household incomes of between $30,000 and $100,000 for families of three. The Pew Research Center defines the middle-income category as including adults with family-of-three equivalent incomes between two-thirds and double the national median. This brings the range from $37,666 to $113,000 according to current levels.
The lower middle class do not live in poverty, but they are often one misfortune away from being hurtled below the poverty line. Brookings Institution defined this group as including those with income between 100 and 250% of the federal poverty level, or between $18,871 and $47,177 for a family of three, according to the current numbers. The lowest class includes any American household that falls under the poverty line, meaning families or individuals who don't earn enough money to meet their basic needs. The Census Bureau estimates that about 14% of the U.S. population (approximately 43 million people) live below the poverty line. The current official poverty threshold is an income of $24,257 per year for a family of four and $18,871 for a family of three.
The "Great Gatsby Curve" is the finding that, among advanced economies, greater income inequality is associated with diminished intergenerational mobility. Inequality is self-reinforcing. Unequally distributed resources, even though they may in part be the outcomes of past efforts and abilities, affect future opportunities for economic achievement. In such circumstances, society faces difficult questions of how best to fairly and justly promote equal opportunity. Equality of opportunity, moreover, extends far beyond economic issues, and includes political participation and access. Inequalities in these areas exacerbate vicious circles in which those born with greater opportunity create the rules of the game that help retain them and their children in positions of wealth and power.
After adjusting for inflation, the average income of the top 5 percent of households grew by 38 percent from 1989 to 2013. By comparison, the average real income of the other 95 percent of households grew less than 10 percent. The wealthiest 5 percent of American households held 54 percent of all wealth reported in the 1989 survey. Their share rose to 61 percent in 2010 and reached 63 percent in 2013.
The average net worth of the lower half of the distribution, representing 62 million households, was $11,000 in 2013. About one-fourth of these families reported zero wealth or negative net worth, and a significant fraction of those said they were "underwater" on their home mortgages, owing more than the value of the home. This $11,000 average is 50 percent lower than the average wealth of the lower half of families in 1989, adjusted for inflation. the average real wealth of families in the top 5 percent nearly doubled, on net -- from $3.6 million in 1989 to $6.8 million in 2013.
|
NEWSLETTER
|
| Join the GlobalSecurity.org mailing list |
|
|
|