

Antarctica - Climate
Winds that flow down the surface of the ice sheet toward the coast (katabatic winds) commonly reach speeds of 80 miles per hour, and maximum measured wind speeds have exceeded 180 miles per hour. Changes in the weather are dramatic: winds shift from calm to full-gale in a brief period of time. A drop of 65°F was once recorded in 12 minutes. Earths lowest surface temperature (-126.9°F) was recorded at Russias Vostok Station in the interior of Antarctica. Coastal locations in summer occasionally rise above the freezing point.
Katabatic (gravity-driven) winds blow coastward from the high interior; frequent blizzards form near the foot of the plateau; cyclonic storms form over the ocean and move clockwise along the coast; volcanism on Deception Island and isolated areas of West Antarctica; other seismic activity rare and weak; large icebergs may calve from ice shelf.
The discovery of a large Antarctic ozone hole in the earth's stratosphere (the ozone layer) - first announced in 1985 - spurred the signing of the Montreal Protocol in 1987, an international agreement phasing out the use of ozone-depleting chemicals; the ozone layer prevents most harmful wavelengths of ultra-violet (UV) light from passing through the earth's atmosphere; ozone depletion has been shown to harm a variety of Antarctic marine plants and animals (plankton); in 2002, significant areas of ice shelves disintegrated in response to regional warming; in 2016, a very gradual trend toward "healing" of the ozone hole was reported.
Offshore cyclones occur with little warning. Winds typically reach hurricane strength within an hour and persist for several days. A concentration of storm formation and/or intensification occurs at approximately 50°S latitude and is associated with some of the most violent seas in the world (the roaring forties). The stretch of ocean between Antarctica and the tip of South America is considered the most hostile in the world and has claimed numerous ships over the centuries.
Antarcticas ice the worlds largest area of cold (the Arctic is 35°F warmer) affects and responds to world climate change. Just 20,000 years ago, the ice sheet was far larger, and correspondingly, sea level was 11 meters (36 feet) lower, as the water was locked up in Antarctic ice.
Millions of square miles of sea ice surround Antarctica; the extent annually experiences a five-fold increase and decrease, with the winter maximum more than doubling the entire Antarctic regions area of ice coverage. Icebergs larger than the State of Connecticut have been observed. The temperature gradient associated with Antarcticas sea-ice zone is one of the strongest on Earth, and the seasonal variability in the extent of sea ice is an important regulator of the climate of the Southern Hemisphere. This is primarily because of the significant difference between sea ice and water in reflecting the suns energy (albedo) and because the sea ice serves as a barrier to energy exchange between atmosphere and ocean.
The West Antarctic Ice Sheet if melted would raise sea level 5 meters. It is less stable than the East Antarctic Ice Sheet because its base is below sea level. Its low-probability/high-impact collapse has stimulated vigorous research over the last 30 years, revealing that it has largely or completely disappeared in the past after it formed but at an unknown rate. Portions of it are changing rapidly now, while averages over the whole ice sheet show little change. Some models project stability, while others suggest the possibility of rapid change.
Ice shelves extensions of continental ice sheets that are afloat on the ocean can control the rate at which their parent ice sheets or glaciers move into the sea and can respond more quickly than ice sheets to environmental change. The Larsen Ice Shelf on the east coast of the Antarctic Peninsula lost massive sections in 1995 and 2002, in response to atmospheric and oceanic warming over the last several decades. Some scientists call it a model for what could happen to larger ice shelves farther south.20 Recently observed excursions of intermediate depth water from the Antarctic Circumpolar Current have the potential to deliver tremendous thermal energy to the underside of the floating ice shelves.
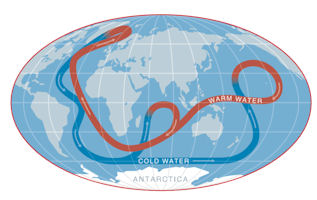
The Antarctic Circumpolar Current transports 130 million cubic meters of water per second towards the east, making it the mightiest of the oceans currents. It influences formation of cold, dense, and nutrient-rich bottom water that extends throughout much of the world ocean and is a key to understanding change in the worlds ocean circulation and its influence on global climate. Recent research has shown that understanding the carbon cycle in the Southern Ocean is critically important to understanding the global carbon cycle.
Research on the marine ecosystem around Antarctica is providing an understanding of the strong coupling in the Southern Ocean between climate processes and ecosystem dynamics2 and helps to understand levels at which harvesting can take place without damaging the ecosystem. Adding to that uncertainty is the problem of ocean acidification, a gradual change in oceanic chemistry due to uptake of atmospheric carbon dioxide by the sea. The extra carbon dioxide that is produced by anthropogenic activity lowers the oceanic pH, potentially affecting the physiology of marine organism and the ability to form shells. Due to its significant role in absorbing anthropogenic carbon dioxide, the Southern Ocean is predicted to be particularly vulnerable to ocean acidification.
The annual eightfold growth and decay of sea ice around Antarctica has been termed the greatest seasonal event on Earth. It affects regional climate and the global heat budget. Particularly near the edges, it nurtures some of the worlds most productive ecosystems.
One of the best examples of basic research about Earths environment that led to important public policy decisions is the story surrounding the Antarctic ozone hole. The discovery of the annual Antarctic ozone depletion, the research that uncovered the cause of the ozone depleting reactions, and the subsequent decisions about phasing out ozone depleting CFCs is a compelling illustration of the value of science to society. Starting in 1979, ozone in the stratosphere over Antarctica has been observed almost to disappear every austral spring. In the 1990s seasonal ozone depletion in the Arctic was first observed. Elsewhere, stratospheric ozone depletions are only incremental. Stratospheric ozone keeps much of the Suns harmful ultraviolet radiation from reaching the Earths surface and therefore, the ozone hole has received widespread attention.
 A 2015 NASA study said that an increase in Antarctic snow accumulation that began 10,000 years ago was currently adding enough ice to the continent to outweigh the increased losses from its thinning glaciers. The research challenged the conclusions of other studies, including the Intergovernmental Panel on Climate Changes (IPCC) 2013 report, which says that Antarctica is overall losing land ice.
According to the new analysis of satellite data, the Antarctic ice sheet showed a net gain of 112 billion tons of ice a year from 1992 to 2001. That net gain slowed to 82 billion tons of ice per year between 2003 and 2008.
Were essentially in agreement with other studies that show an increase in ice discharge in the Antarctic Peninsula and the Thwaites and Pine Island region of West Antarctica, said Jay Zwally, a glaciologist with NASA Goddard Space Flight Center in Greenbelt, Maryland, and lead author of the study, which was published on Oct. 30 in the Journal of Glaciology. Our main disagreement is for East Antarctica and the interior of West Antarctica there, we see an ice gain that exceeds the losses in the other areas. Zwally added that his team measured small height changes over large areas, as well as the large changes observed over smaller areas.
The extra snowfall that began 10,000 years ago has been slowly accumulating on the ice sheet and compacting into solid ice over millennia, thickening the ice in East Antarctica and the interior of West Antarctica by an average of 0.7 inches (1.7 centimeters) per year. This small thickening, sustained over thousands of years and spread over the vast expanse of these sectors of Antarctica, corresponds to a very large gain of ice enough to outweigh the losses from fast-flowing glaciers in other parts of the continent and reduce global sea level rise.
The good news is that Antarctica is not currently contributing to sea level rise, but is taking 0.23 millimeters per year away, Zwally said. But this is also bad news. If the 0.27 millimeters per year of sea level rise attributed to Antarctica in the IPCC report is not really coming from Antarctica, there must be some other contribution to sea level rise that is not accounted for.
 Gravity data collected from space using NASA's Gravity Recovery and Climate Experiment (Grace) satellite show that Antarctica has been losing more than a hundred cubic kilometers (24 cubic miles) of ice each year since 2002. The data reveal that Antarctica is losing ice at an accelerating rate, too. How is it possible for surface melting to decrease, but for the continent to lose mass anyway? The answer boils down to the fact that ice can flow without melting.
Two-thirds of Antarctica is a high, cold desert. Known as East Antarctica, this section has an average altitude of about 2 kilometer (1.2 miles), higher than the American Colorado Plateau. There is a continent about the size of Australia underneath all this ice; the ice sheet sitting on top averages at a little over 2 kilometer (1.2 miles) thick. If all of this ice melted, it would raise global sea level by about 60 meter (200 feet). But little, if any, surface warming is occurring over East Antarctica. Radar and laser-based satellite data show a little mass loss at the edges of East Antarctica, which is being partly offset by accumulation of snow in the interior.
West Antarctica is very different. Instead of a single continent, it is a series of islands covered by ice -- think of it as a frozen Hawaii, with penguins. Because it's a group of islands, much of the West Antarctic Ice Sheet (WAIS, in the jargon) is actually sitting on the floor of the Southern Ocean, not on dry land. Parts of it are more than 1.7 kilometer (1 mile) below sea level. Pine Island is the largest of these islands and the largest ice stream in West Antarctica is called Pine Island Glacier. The WAIS, if it melted completely, would raise sea level by 5 to 7 meter (15 to 25 feet).
The retreat of West Antarctica's glaciers is being accelerated by ice shelf collapse. Ice shelves are the part of a glacier that extends past the grounding line towards the ocean they are the most vulnerable to warming seas. A longstanding theory in glaciology is that these ice shelves tend to buttress (support the end wall of) glaciers, with their mass slowing the ice movement towards the sea, and this was confirmed by the spectacular collapse of the Rhode Island-sized Larsen B shelf along the Eastern edge of the Antarctic Peninsula in 2002.
The main cause of the loss of the Antarctic ice sheet is the thinning of the ice shelves floating on the surface of the ocean waters that surround and support the Antarctic ice sheet. Thick, stable ice shelves perform this support role more effectively, but as they have thinned in recent decades, they are less able to support Antarctic ice, and this is causing the decline of land ice in the ocean to accelerate, leading to a rise in global sea levels.
An ice shelf is an extension of land ice that extends from the coast to the surface of the ocean, and plays an important role in preventing the flow of land ice into the ocean. These ice shelves are based on ice anchors located under the sea surface, and can be seen prominently on the surface of the ice shelf. These anchors are known as "anchor points" that support the floating ice shelf and the ground ice sheet behind it. Most of the ice shelves on the planet are located within the borders of Antarctica, and floating ice shelves constitute 75% of the coast of Antarctica, and cover an area equivalent to the size of Greenland.
It is possible to scientifically identify the change in the thickness of the ice shelf by measuring the change in the area of ??the apparent surface expression of the anchor points, which is the scientific method that the study used to identify the thinning of the ice shelves over a period of 50 years. Research has shown that stabilization points that support ice shelves and help prevent Antarctica's land ice from sliding into the ocean are more than twice as thin as they were 50 years ago.
By 2024 more than a third of these frozen anchorages, known as anchor points, have decreased in size since the turn of the twentieth century, and this would accelerate Antarctica's contribution to rising sea levels. This phenomenon occurs in Antarctica due to climate warming, which leads to a rise in global sea levels, and this underscores the need to take possible measures to reduce global carbon emissions.
Anchorage points are a common occurrence off the coast of Antarctica. Anchorage points form when part of a floating ice sheet attaches itself to a high point on the ocean floor, creating a bulge on the smooth surface of the ice shelf that can be seen in optical satellite images. Anchoring points are an important indicator of the thickness of the ice shelf. Protrusions that become smaller or become completely smooth over time indicate that the ice shelf has become thin, and may have become unstable. Therefore, anchor points are used as a guide to determine the thickness of the ice shelf.
|
NEWSLETTER
|
| Join the GlobalSecurity.org mailing list |
|
|
|