Volume 12, Number 1, January 2006
Real-time Estimates in Early Detection of SARS
Simon Cauchemez,*† Pierre-Yves Boëlle,*†‡ Christl A. Donnelly,§ Neil
M Ferguson,§ Guy Thomas,*†‡ Gabriel M Leung,¶ Anthony J Hedley,¶ Roy M
Anderson,§ and Alain-Jacques Valleron*†‡
*Institut National de la Santé et de la Recherche Médicale, Paris, France;
†Université Pierre et Marie Curie, Paris, France; ‡Assistance Publique–Hôpitaux
de Paris, Paris, France; §Imperial College, London, United Kingdom; and
¶University of Hong Kong, Hong Kong Special Administrative Region, People's
Republic of China
 |
|
| Back to article | |
|
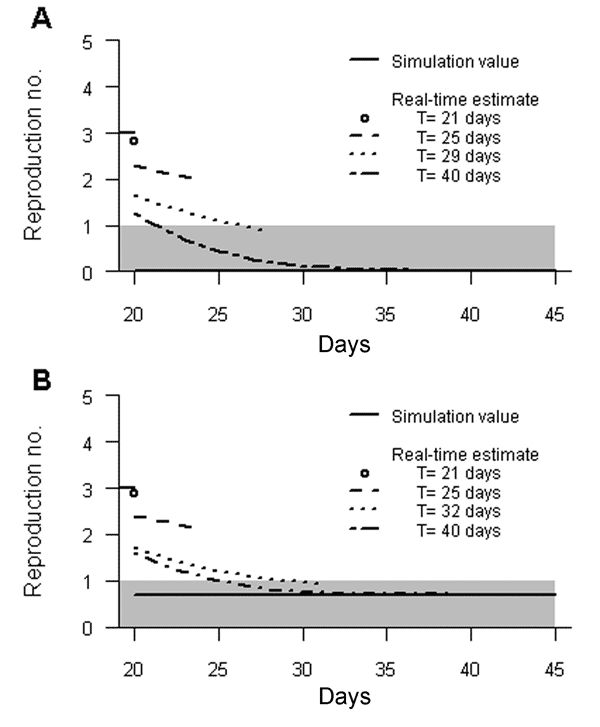
Figure 2. Average expectation of the temporal pattern of Rt after implementation of control measures according to the day T of the last observation. A) Completely effective control measures. B) Limited control measures. Simulation values of R are also given: before day 20, R = 3; after day 20 R = 0 (A) and R = 0.7 (B). The gray zone indicates that R is <1. Information that the average expectation of R has passed <1 was obtained 9 (A) and 12 (B) days after control measures were implemented. |
|
NEWSLETTER
|
| Join the GlobalSecurity.org mailing list |
|
|
|

