
2005 Hurricane Rita
This visualization shows the sea surface temperature from September 17 to September 21 when temperatures in the Gulf of Mexico remained one to two degrees warmer than the 82 degree minimum needed to sustain a hurricane. Every area in yellow, orange or red represents 82 degrees F or above. Temperature data is from the AMSR-E instrument on the Aqua satellite, while the cloud images of Hurricane Rita were taken by the Imager on the GOES-12 satellite.
| Overview satellite imagery of Hurricane Rita | |
|
|
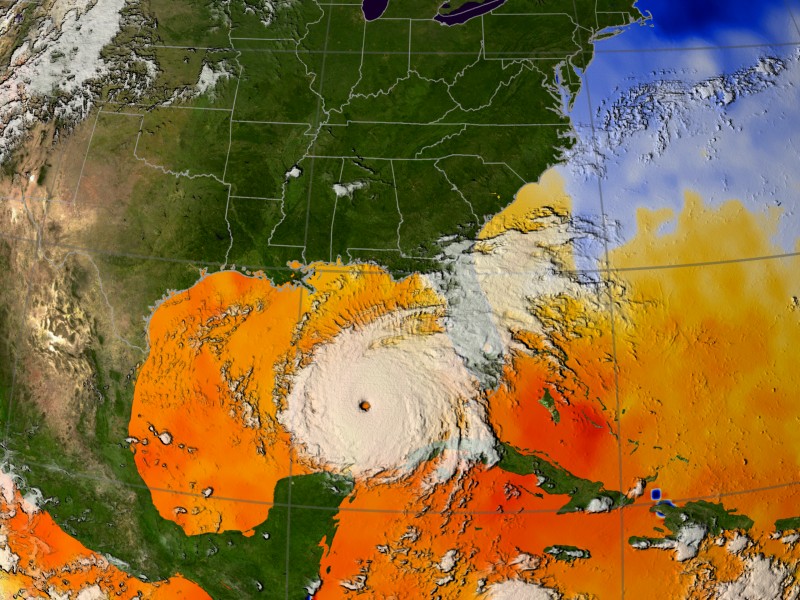 Overview satellite imagery of Hurricane Rita
[Source:NASA] |
|
NEWSLETTER
|
| Join the GlobalSecurity.org mailing list |
|
|
|